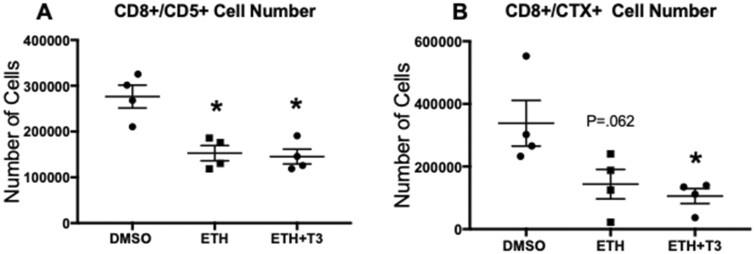
Figure 9.
Cell Numbers for (A) mature CD8+/CD5+ and (B) immature CD8+/CTX+ tadpole thymocytes determined by flow cytometry following 1-week-long exposure to ethylene glycol (ETH) with or without T3. Data presented include mean and SEM with N = 4. Statistical significance is denoted by * where p < .05 using 1-way ANOVA and Tukey’s post hoc test.

