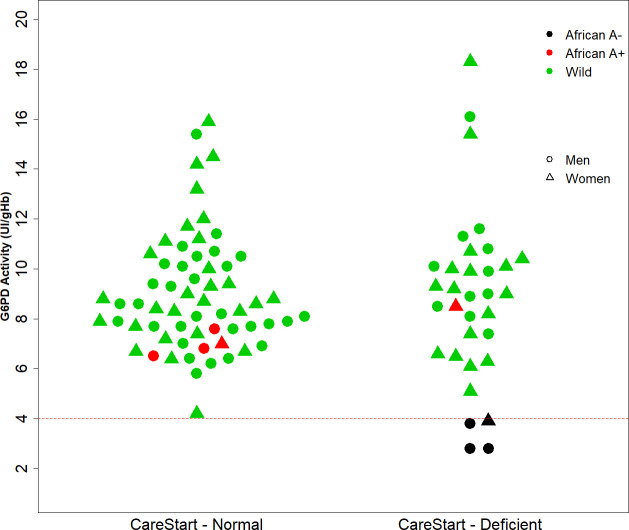
Fig 3. G6PD activity quantitation and genotyping of G6PD RDT normal and deficient samples.
G6PD activity measured by point-of-care quantification (Y axis) is shown for CareStart RDT normal and deficient samples (X axis left and right, respectively) in Rio Preto da Eva, Brazil. G6PD African A-, African A+ and wild type variants are indicated by black, red and green colors, respectively. Circles below the red-dashed line (cut-off point 4.0 UI/g Hb) are considered G6PD deficient (<30%) as per quantitative test results.

