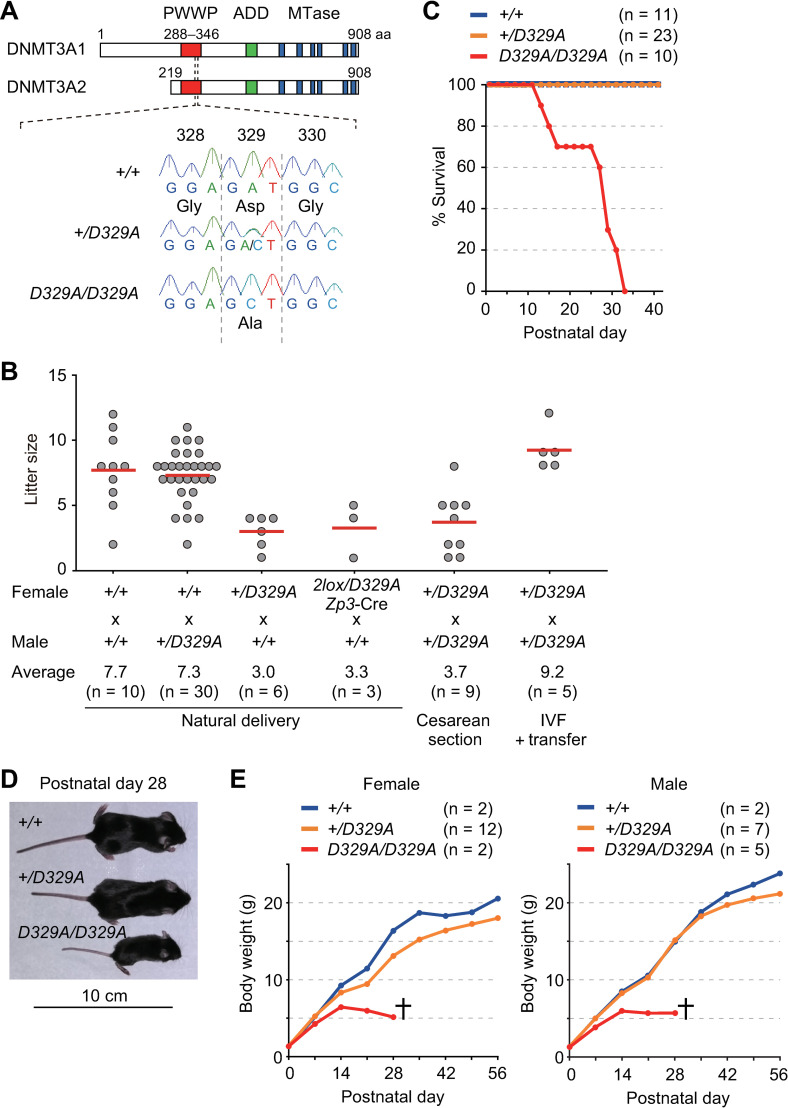
Fig 1. The generation and phenotypic analysis of Dnmt3aD329A mice.
(A) The structure of mouse DNMT3A (DNMT3A1 and DNMT3A2) and the position of D329A substitution. Known domains are indicated by colored boxes. Oocytes express both DNMT3A1 and DNMT3A2 while most other cell types only express DNMT3A1. An example of genotyping by Sanger sequencing is shown. (B) Litter size at birth obtained upon various crosses. Horizontal bars represent the mean litter size. (C) Postnatal survival of pups of each genotype. (D) Gross morphology of mice representative of each genotype. (E) Body weight changes of each genotype during postnatal development.

