
Figure 3.
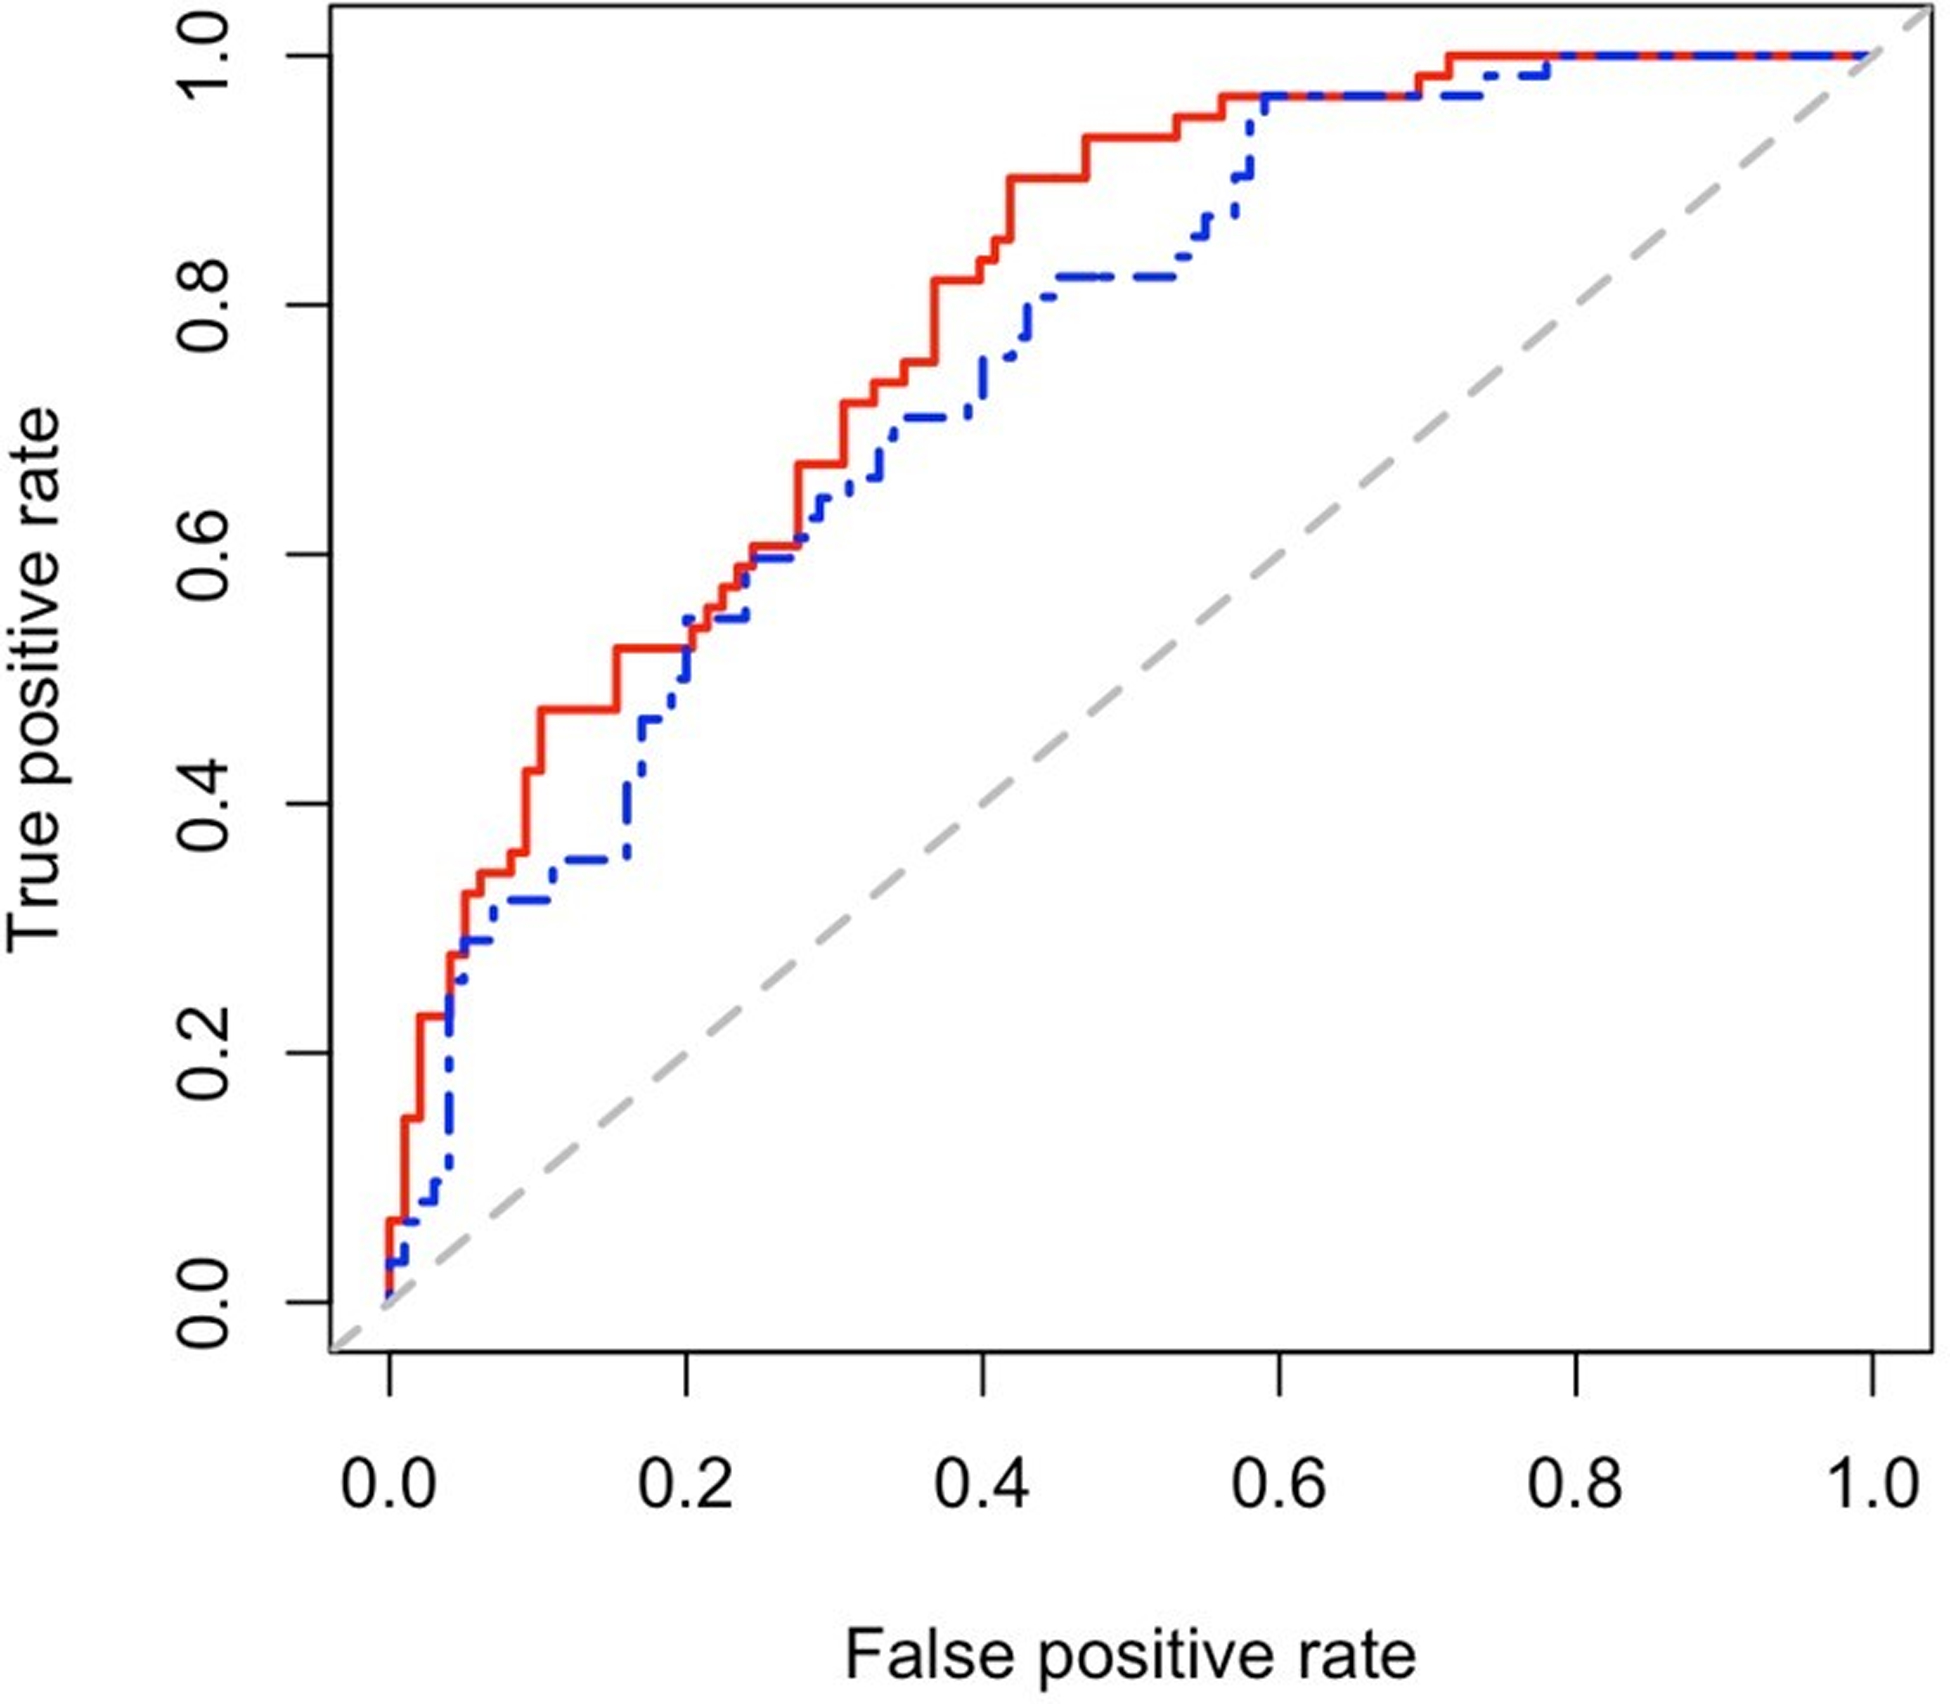
Receiver operating characteristic curve for prediction of presence of high-risk coronary calcium among patients with rheumatoid arthritis. Blue line represents curve for clinical predicators alone (c-statistic = 0.75 (95% CI: 0.68, 0.83)) and red line represents curve for clinical predictors plus miRNA panel let-7c-5p, miR-30e-5p, miR-4446–3p, miR-126–5p, miR-3168, miR-425–5p, miR-126–3p, miR-30a-5p, and miR-125a-5p (c-statistic = 0.80 (95% CI: 0.73, 0.86)).