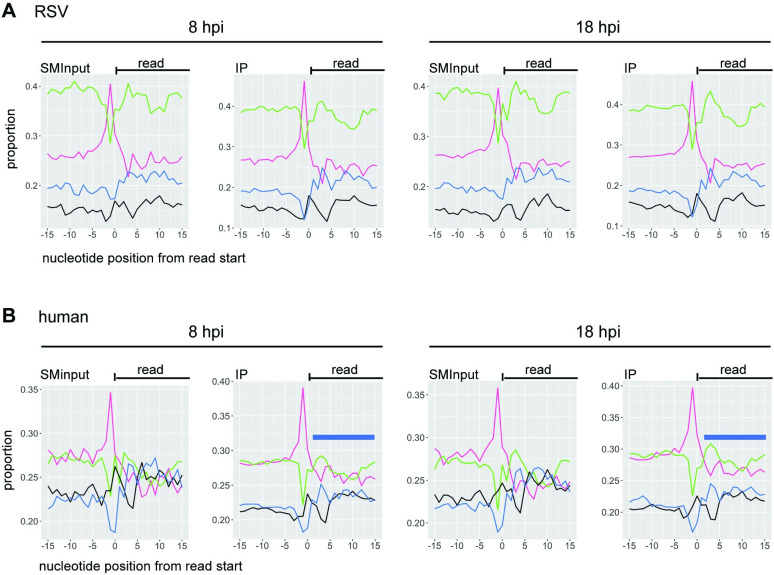
Fig 5. Nucleobase composition adjacent to cross-link sites.
(A and B) Frequency of each nucleotide flanking the point of crosslinking for RSV (A) and human (B) aligned reads. The x-axis represents the nucleotides flanking the read end (position 0) and the y-axis represents the frequency of each nucleotide identity at the given positions. The different lines represent A (green), U (magenta), G (black) and C (blue). Graphs represent the average values per position for the combined 8 (n = 2) and 18 (n = 3) hpi samples. The blue bars in panel B indicate the region of AU-enriched sequence in the M2-1 IP samples.

