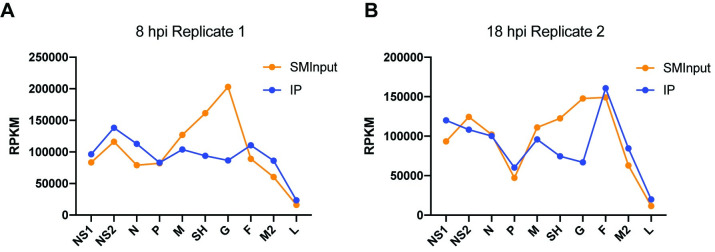
Fig 7. M2-1: RNA interactions show evidence of a transcription gradient.
RPKM values were calculated for RSV positive sense sequences represented in the SMInput and IP datasets and plotted against each of the RSV genes. The figure shows graphs for the 8 hpi replicate 1 (A) and 18 hpi replicate 2 samples (B); graphs for the other samples are presented in S3 Fig.

