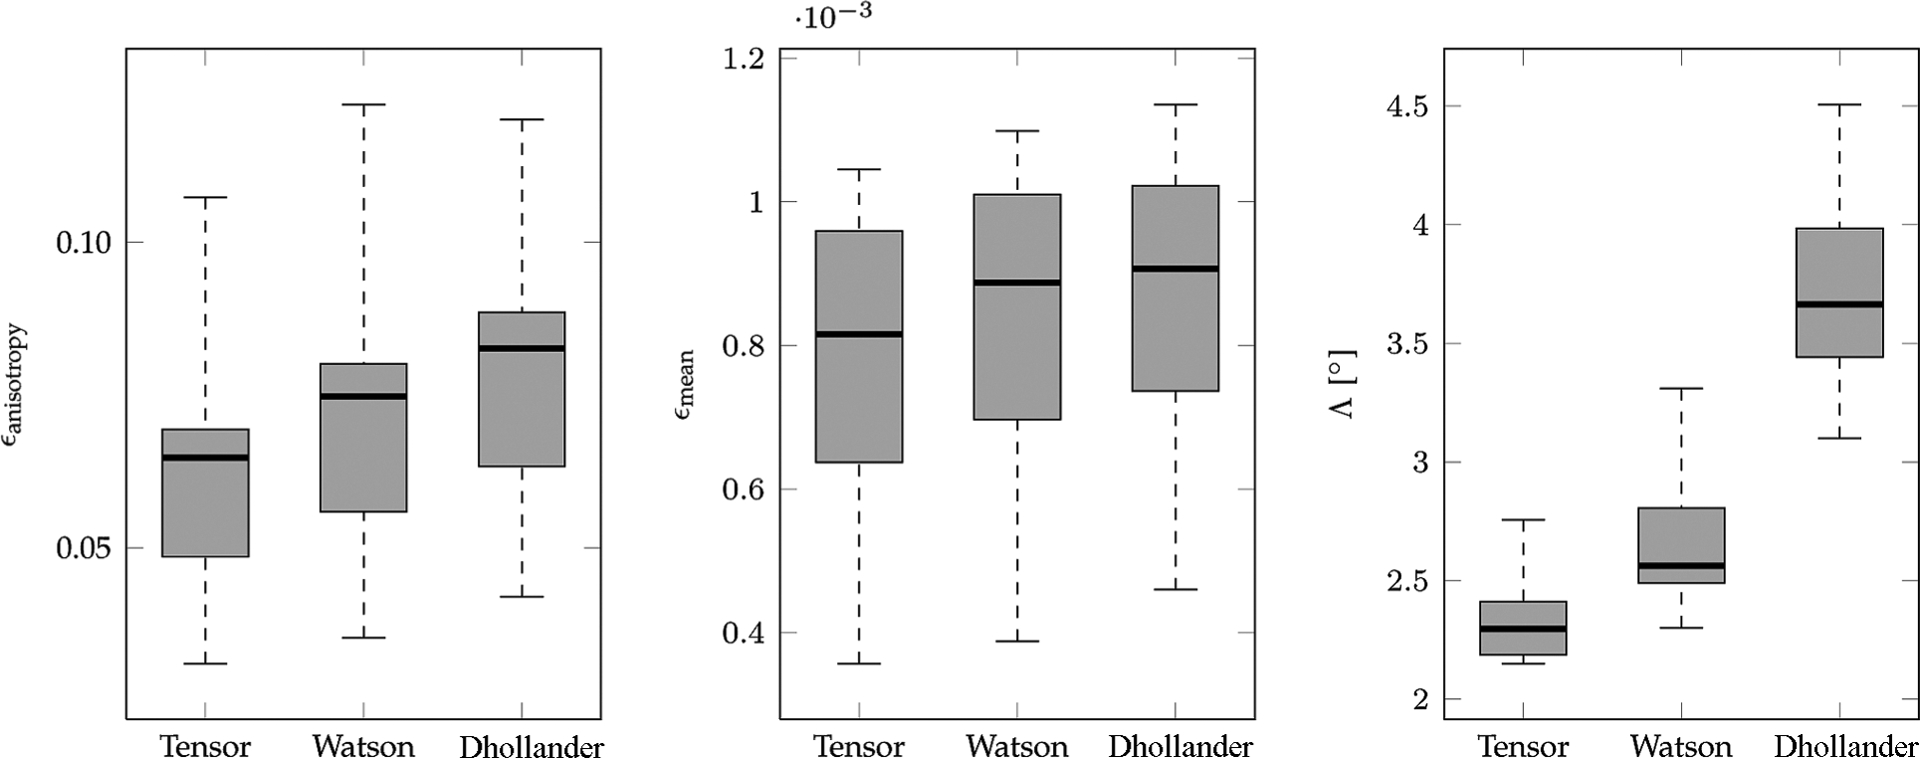
Fig. 12.

Reorientation performance statistics. The change in anisotropy, the change in isotropy, and the orientational discrepancy in association with reorientation are shown in box plots. The bottom and top of the box are the lower and upper quartiles, respectively. The band near the middle of the box is the median. The ends of the whiskers are the minimum and maximum values.
