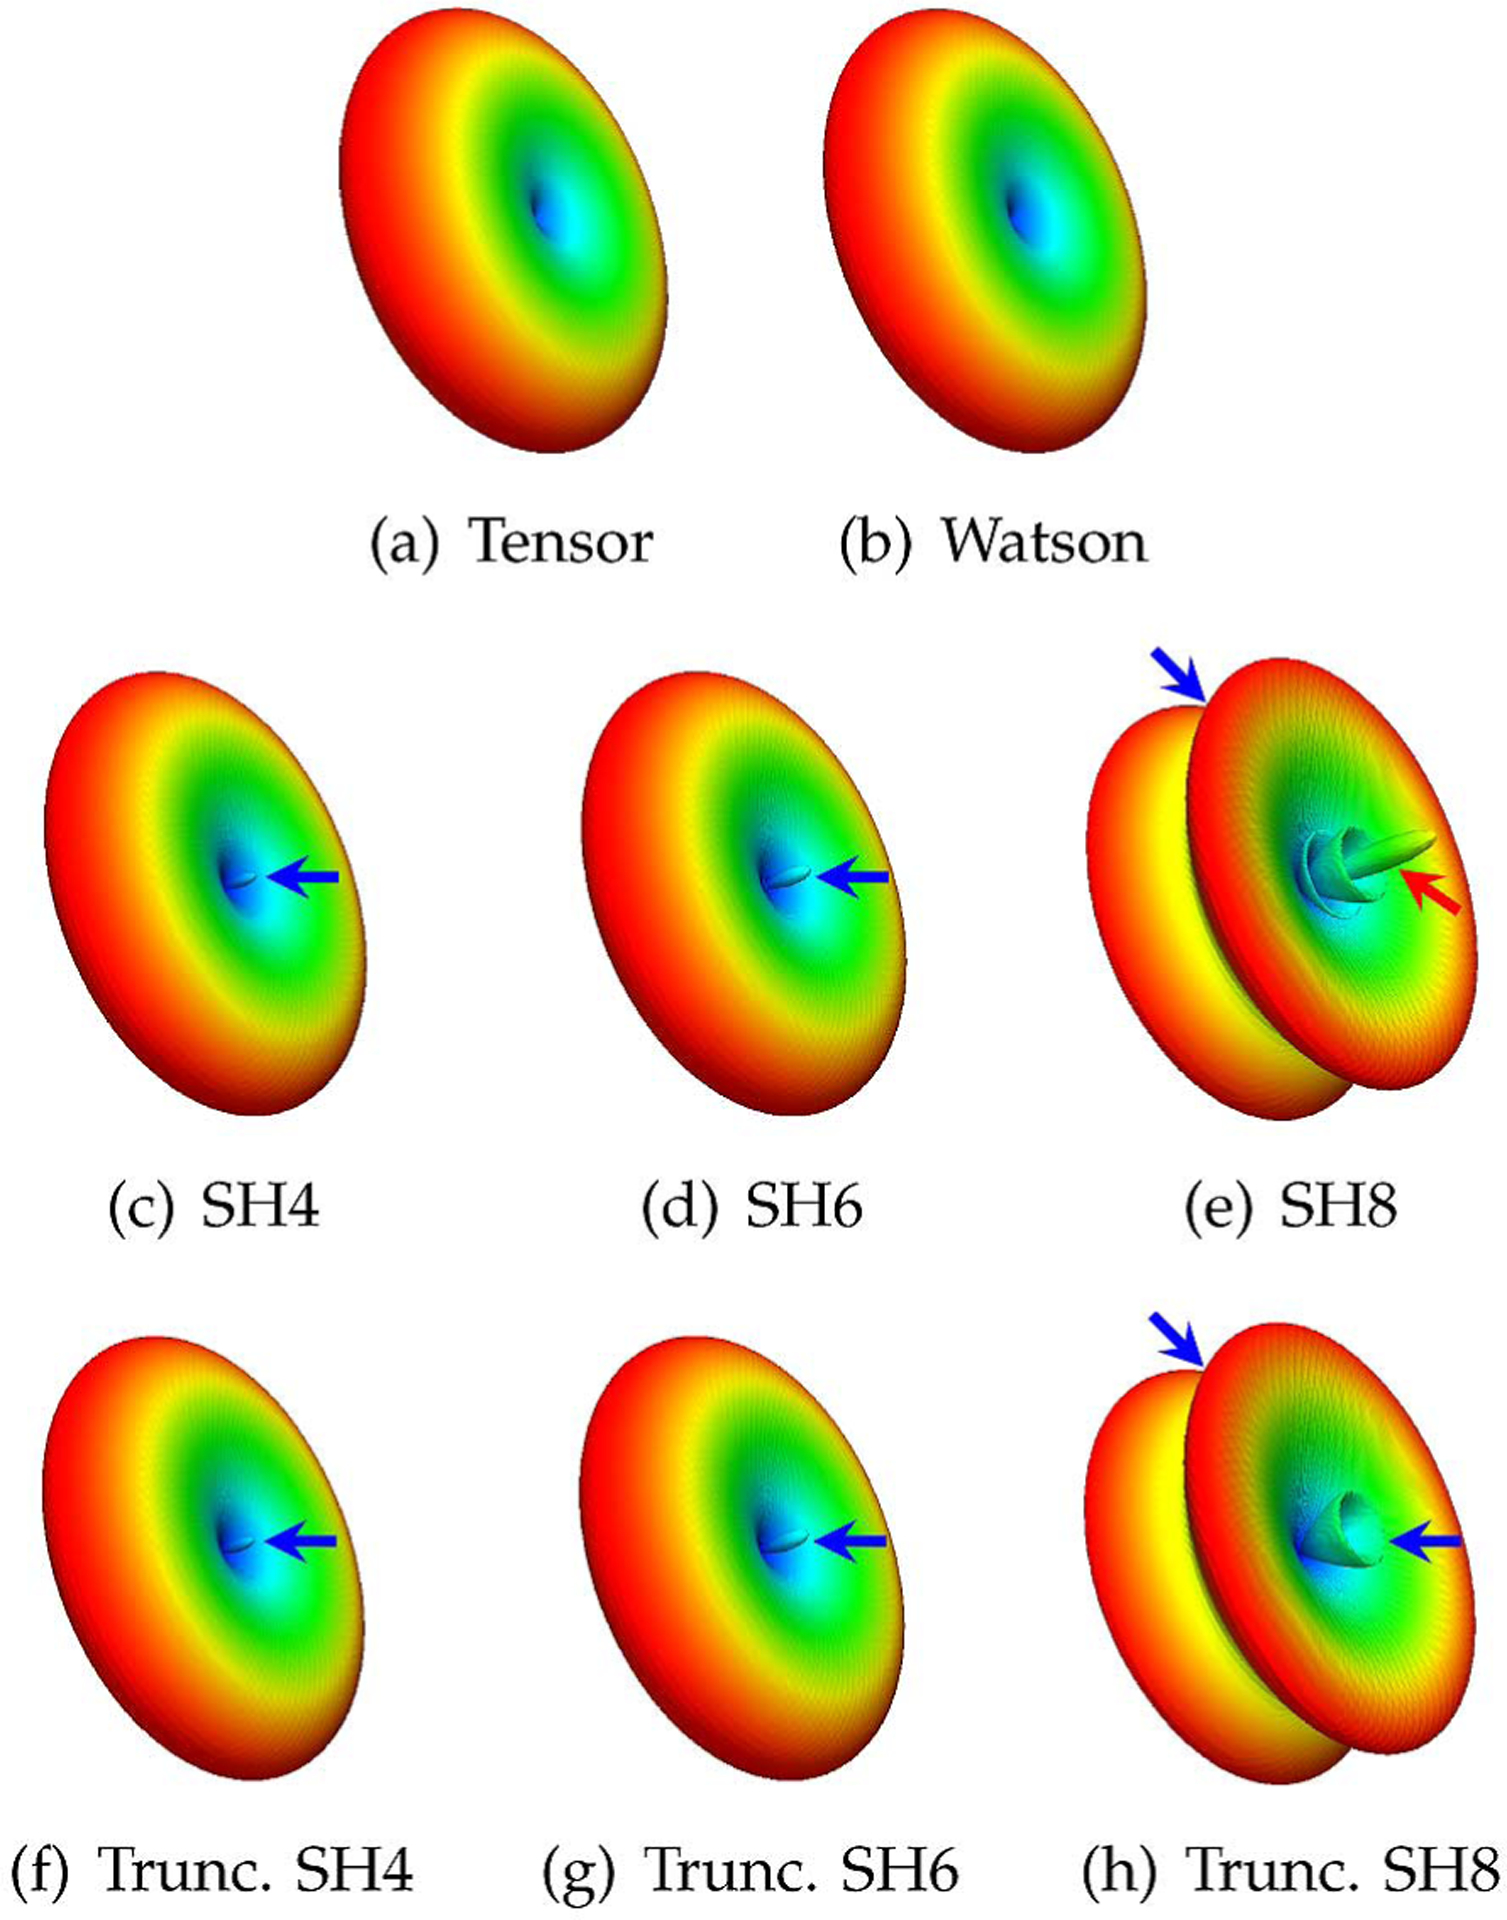
Fig. 2.

Diffusion basis functions. Typical basis functions generated using (a) the tensor model, (b) the Watson distribution function, (c)–(e) the Dhollander basis functions [21] generated using SHs with maximum orders of 4, 6, and 8, and (f)–(h) the Dhollander basis functions modified by truncating the negative lobes. The red arrow marks the negative lobes. The blue arrows mark the problematic areas that will prevent the basis function from accurately representing the diffusion-attenuated signals.
