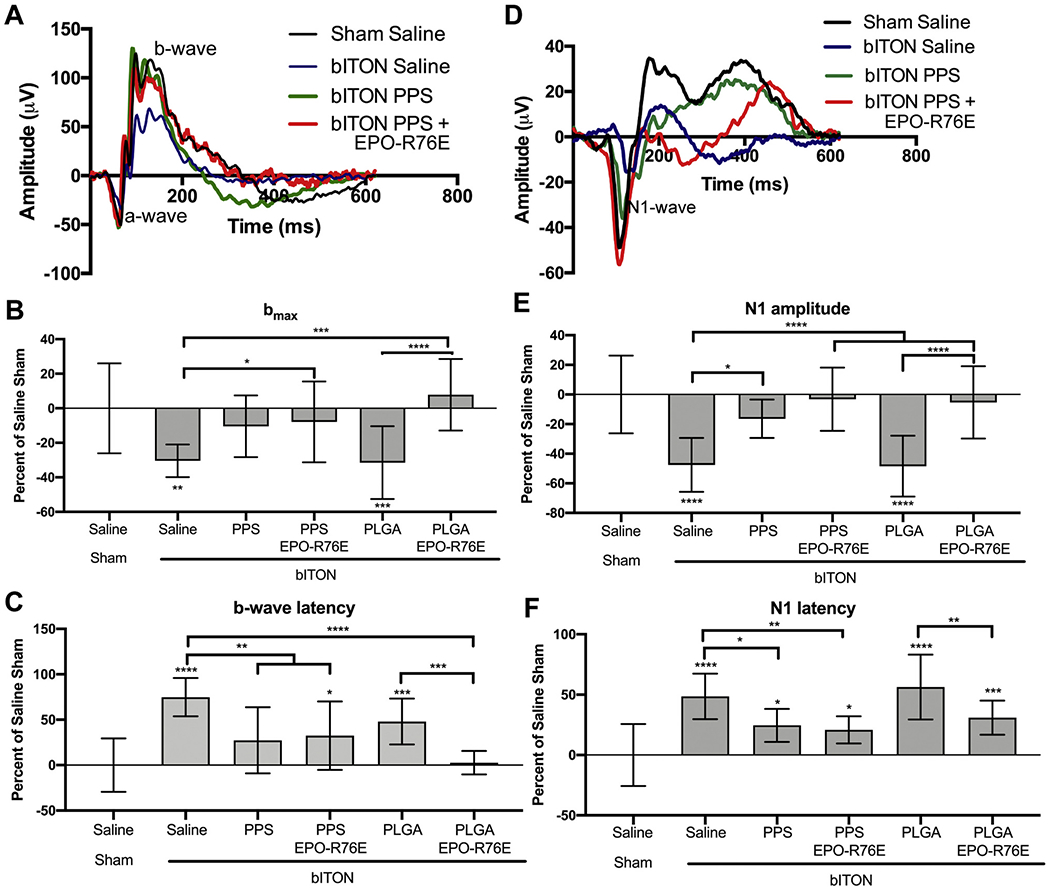
Fig. 6.

Preservation of visual function at 30-days post-injury following treatment on day 1 after injury. A) Representative ERG waveforms. B) Quantification of the b-wave amplitude. C) Quantification of the b-wave latency. D) Representative VEP waveforms. E) Quantification of the VEP N1-wave amplitude. F) Quantification of the VEP N1-wave latency. All data shown as percent change from saline sham controls. *p < 0.05, **p < 0.01, ***p < 0.001, #p < 0.0001 compared to bITON saline.
