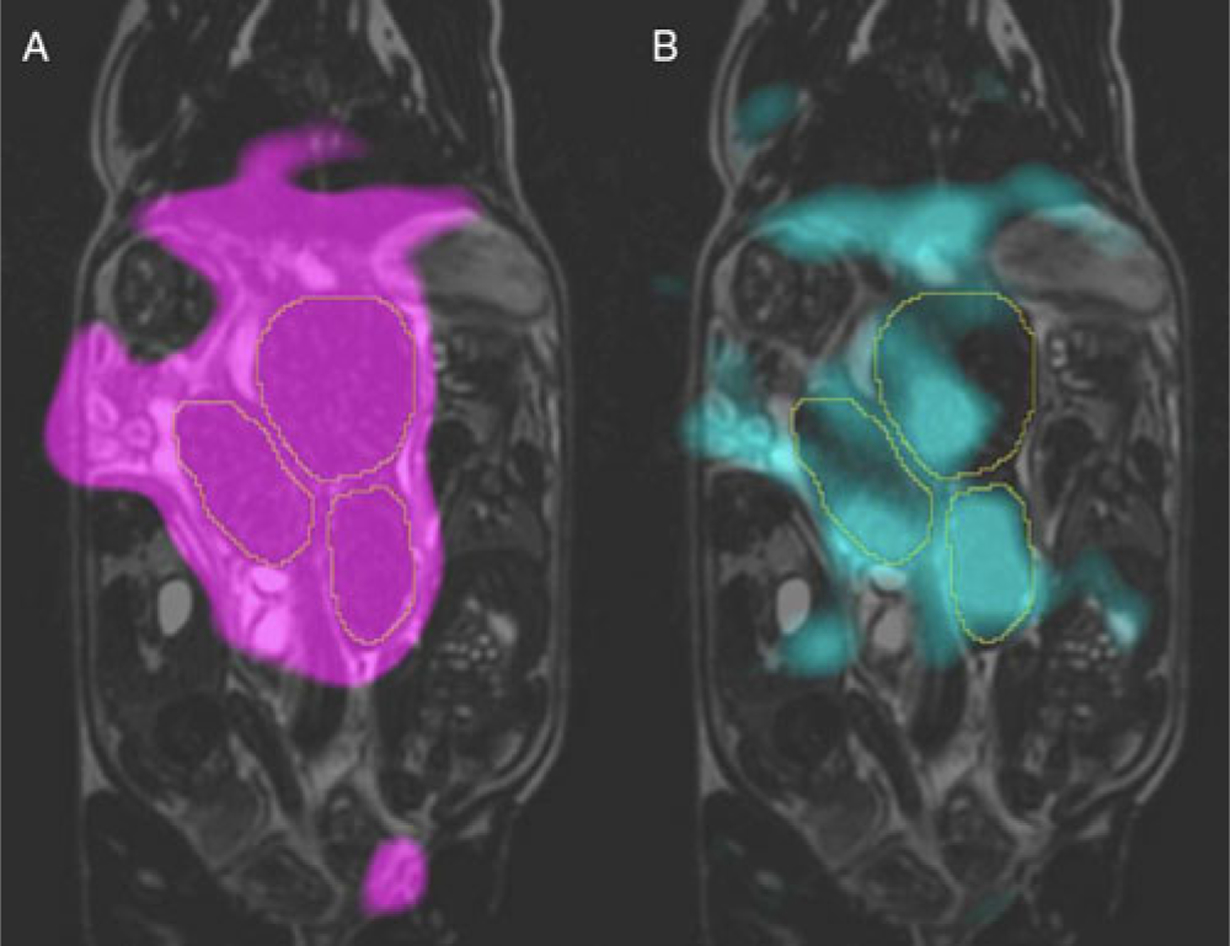
Fig. 3.

Typical hyperpolarized 13C metabolite images overlaid on coronal T2 of the same guinea pig at 22.5 s post-injection of [1-13C]pyruvate solution. Images of signal from two metabolites are shown here: pyruvate is shown in magenta (A) and lactate in cyan (B). The placentae are outlined in each image Image courtesy of L. Smith, L. Friesen-Waldner, and T. Regnault.
