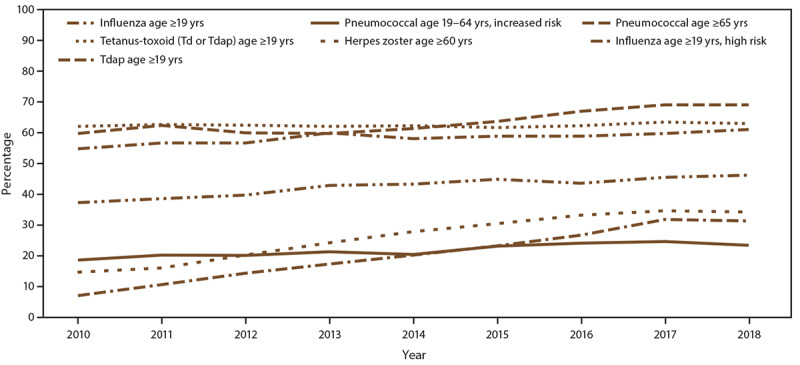
FIGURE.

Estimated proportion of adults aged ≥19 years who received selected vaccines, by age group and risk status — National Health Interview Survey, United States, 2010–2018
NOTE: An additional table for this figure is available at http://stacks.cdc.gov/view/cdc/105534.
Abbreviations: Td = tetanus and diphtheria toxoids; Tdap = tetanus toxoid, reduced diphtheria toxoid, and acellular pertussis vaccine.
