. 2020 Sep 24;11(41):11322–11330. doi: 10.1039/d0sc04520a

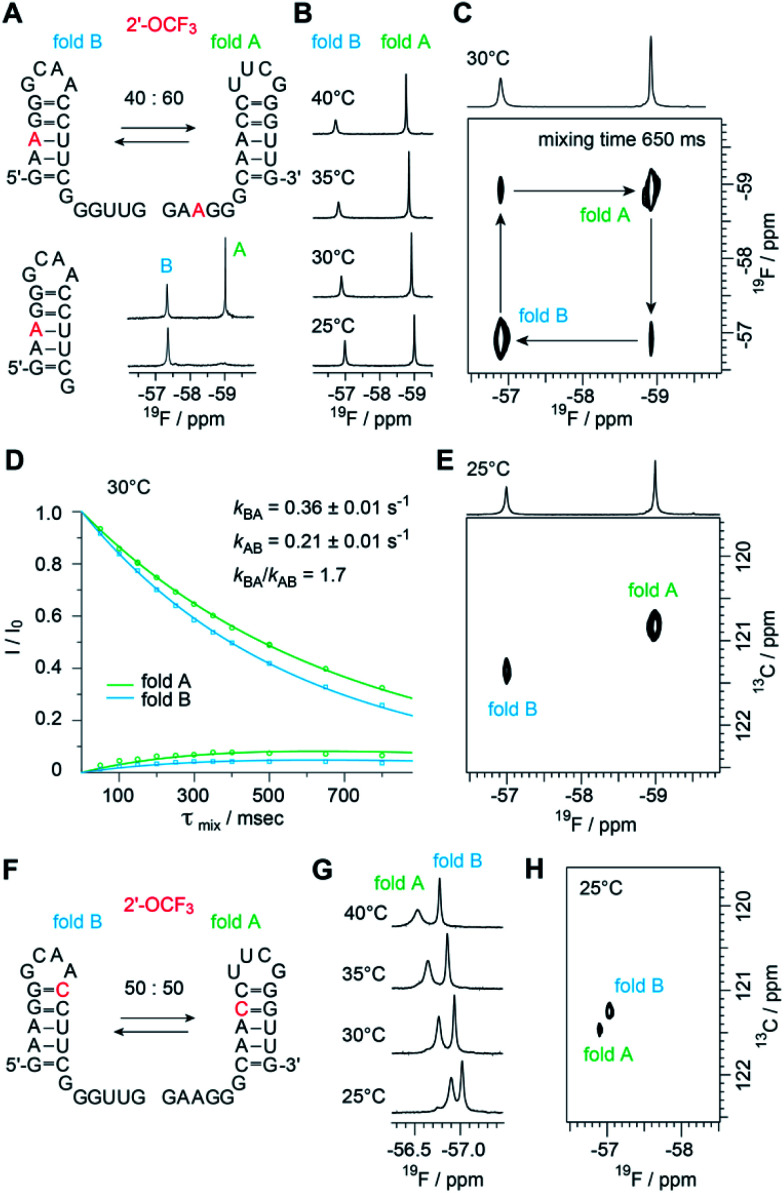
Fig. 5. Structure probing of a bistable RNA with a single 2′-OCF3 label. (A) Secondary structure of full-length (top left) and reference RNA (bottom left), both with the 2′-OCF3 labeled A3, and 19F-NMR (470 MHz) spectra (bottom right). Conditions: c(RNA) = 0.3 mM, 15 mM sodium cacodylate, 25 mM NaCl, pH 6.5, H2O/D2O = 9 : 1, 298 K; (B) temperature-dependent series of 19F-NMR (564 MHz) spectra. (C) 19F/19F-EXSY (564 MHz) spectrum (650 ms mixing time, same conditions as in (A)). The crosspeaks between the 19F resonances assigned to the two folds originate from a chemical exchange process between the two folds at the millisecond time scale. (D) Exchange peaks build-up and R1 decay curves of the exchange experiment for residue A3 for the forward and backward folding event. Exchange rates are indicated, the following longitudinal relaxation rates were obtained: R1A = 1.01 ± 0.11 s−1, R1B = 1.56 ± 0.18 s−1. The experiments were run at mixing times ranging from 50 ms to 800 ms at 303 K. Dots are the experimental data, fits are shown as solid lines. Error rates were determined by Monte Carlo analysis with peak intensities randomly modulated according to noise levels exchange spectra. (E) 19F–13C HSQC spectrum of the RNA shown in panel A. (F) Same RNA but with 2′-OCF3 label at C10. (G) Temperature-dependent series of 19F-NMR spectra. (H) 19F–13C HSQC spectrum of the RNA shown in panel F.

Fig. 5