
FIGURE 1:
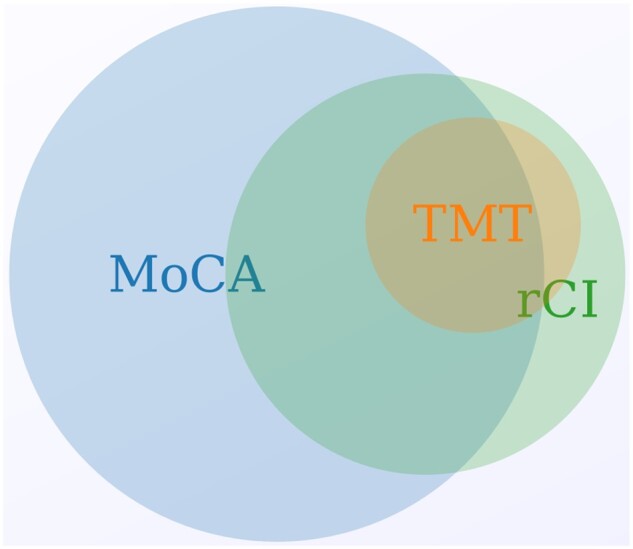
A proportionate Venn diagram demonstrating the overlapping definitions of cognitive impairment according to the different cognitive tests and definitions used. Created using meta-chart.com.
Official websites use .gov
A
.gov website belongs to an official
government organization in the United States.
Secure .gov websites use HTTPS
A lock (
) or https:// means you've safely
connected to the .gov website. Share sensitive
information only on official, secure websites.
A proportionate Venn diagram demonstrating the overlapping definitions of cognitive impairment according to the different cognitive tests and definitions used. Created using meta-chart.com.