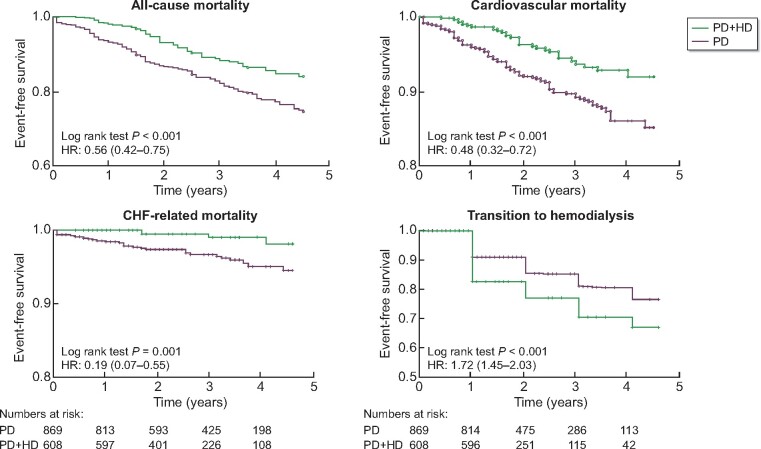
FIGURE 2:
Comparison of all-cause mortality, CV mortality, CHF-related mortality and transition to HD among PS-matched cohort. Time 0 indicated the time when combination therapy was started for PD + HD patients and the time of matching for PD alone patients. The numbers at risk were shown below the graphs. The numbers at risk were the same for all-cause, CV and CHF-related mortality. PD + HD, combination of PD with once-weekly HD.

