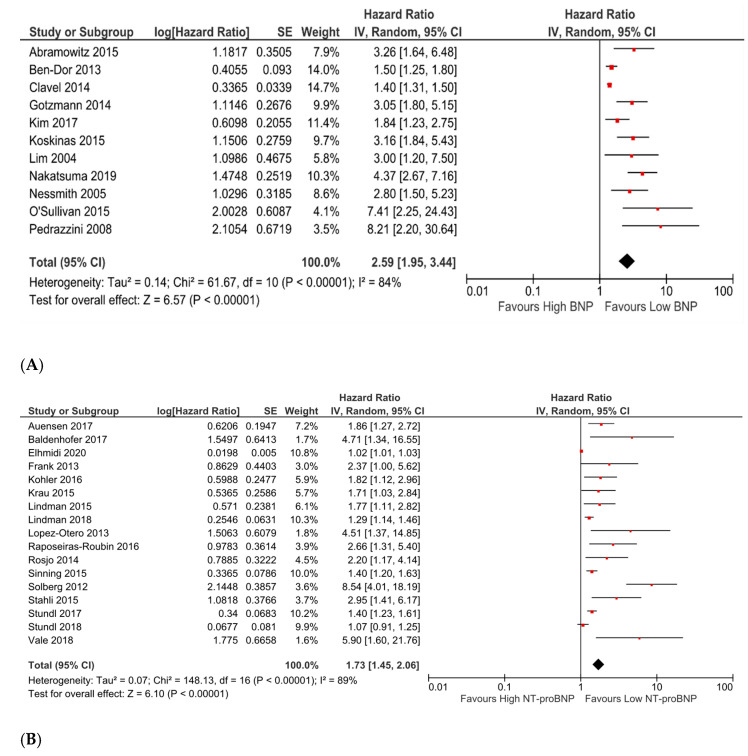
Figure 1.
(A). Forest plot of hazard and risk ratios of all-cause mortality for high vs. low levels of baseline BNP using a random-effect model. This indicates that when comparing groups of high vs. low BNP as defined by the authors, there was over double the risk of mortality in the higher group. CI: confidence interval; IV: inverse variance. (B). Forest plot of hazard and risk ratios of all-cause mortality for high vs. low levels of baseline NT-proBNP using a random-effect model. This indicates that there was 1.73 times the risk of mortality associated with the high-level group. CI: confidence interval; IV: inverse variance.

