. 2020 Oct 2;11(43):11859–11868. doi: 10.1039/d0sc04235h

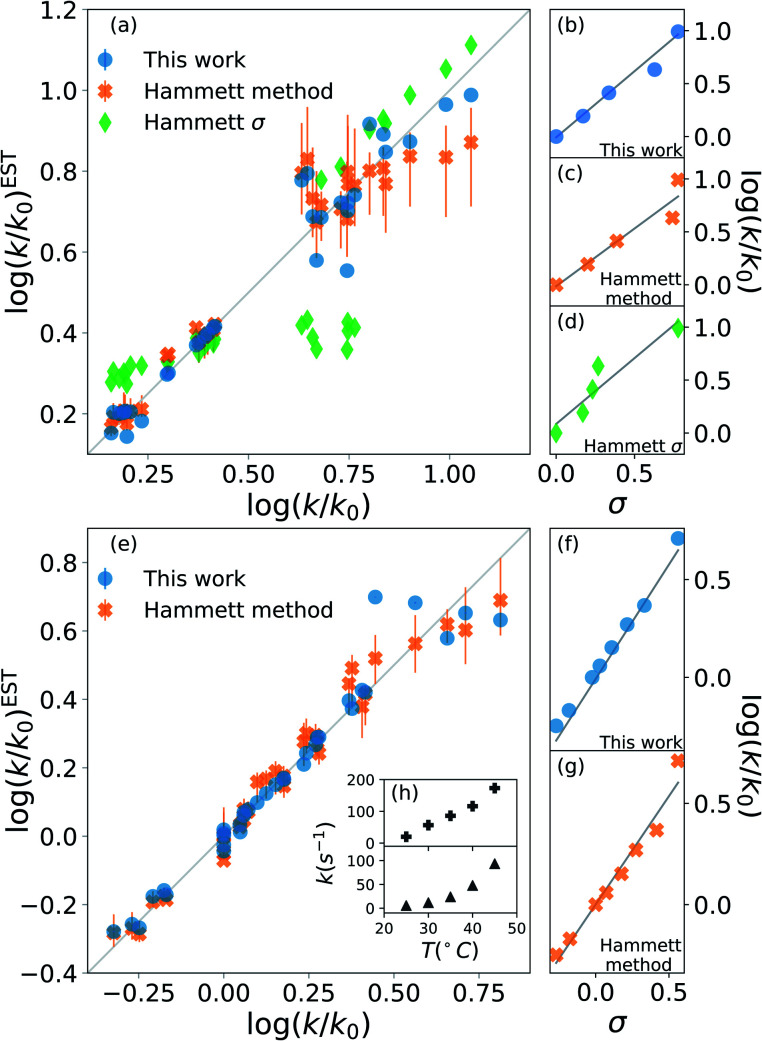
Fig. 2. Prediction of kinetic constants on two experimental reaction data set: nucleophilic substitution between benzylbromides and thiols78 (top half) and decomposition of ammonium salts (bottom half).79 The picture compares results from our model (blue circles), from the original Hammett procedure (orange crosses) and from the tabulated parameters of the original paper (green diamonds).1 The correlation plots (a) and (e) show the higher reliability of our method for the prediction of the rate constants when compared to the others. The error bars display the dependence on the reference reaction. The Hammett plots on the right ((b), (c), (d), (f) and (g)) show the increased robustness of our method with respect to outliers and the preservation of the relative ordering of the substituent constants σ. The inset (h) reports the temperature dependence of the rate constants for the decomposition of two different ammonium salts, highlighting how the outliers correspond to unphysical behaviour.

Fig. 2