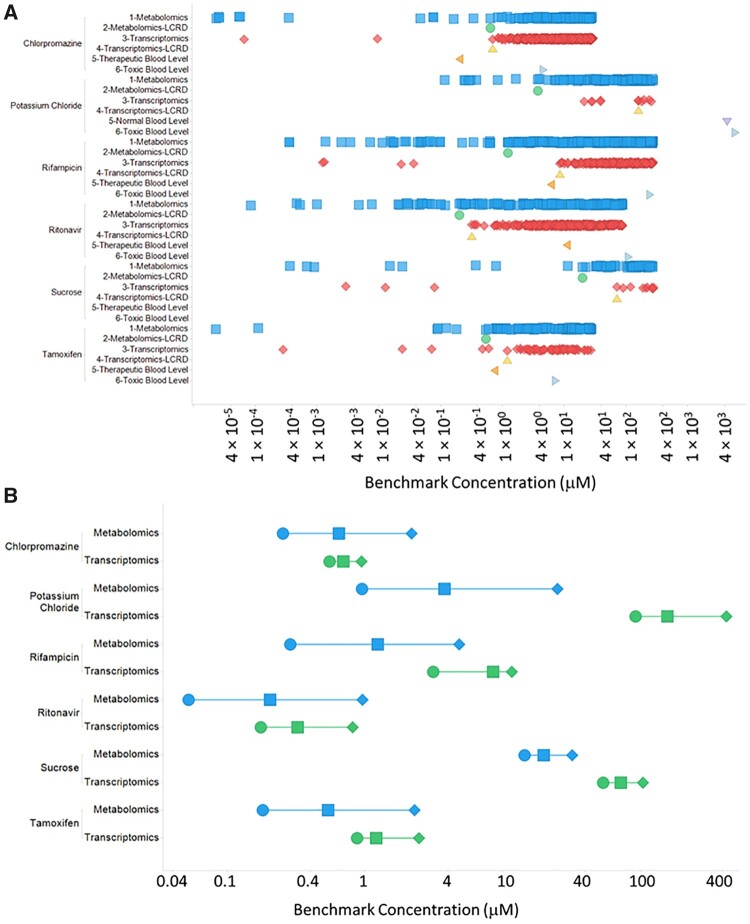
Figure 5.
A, BMC distribution scatter plots showing BMC values for metabolomic features (blue squares), metabolomic LCRD values (green circles), transcriptomic features (red diamonds), transcriptomic LCRD values (light yellow triangles), therapeutic/normal blood levels (if available; orange sideways triangles) and toxic blood levels (if available; light blue sideways triangles). B, Metabolomic and transcriptomic LCRD range plot showing the 95% lower (BMCL) (circles) and upper bound (BMCU) (diamonds) around the BMC that corresponds to the LCRD (squares).

