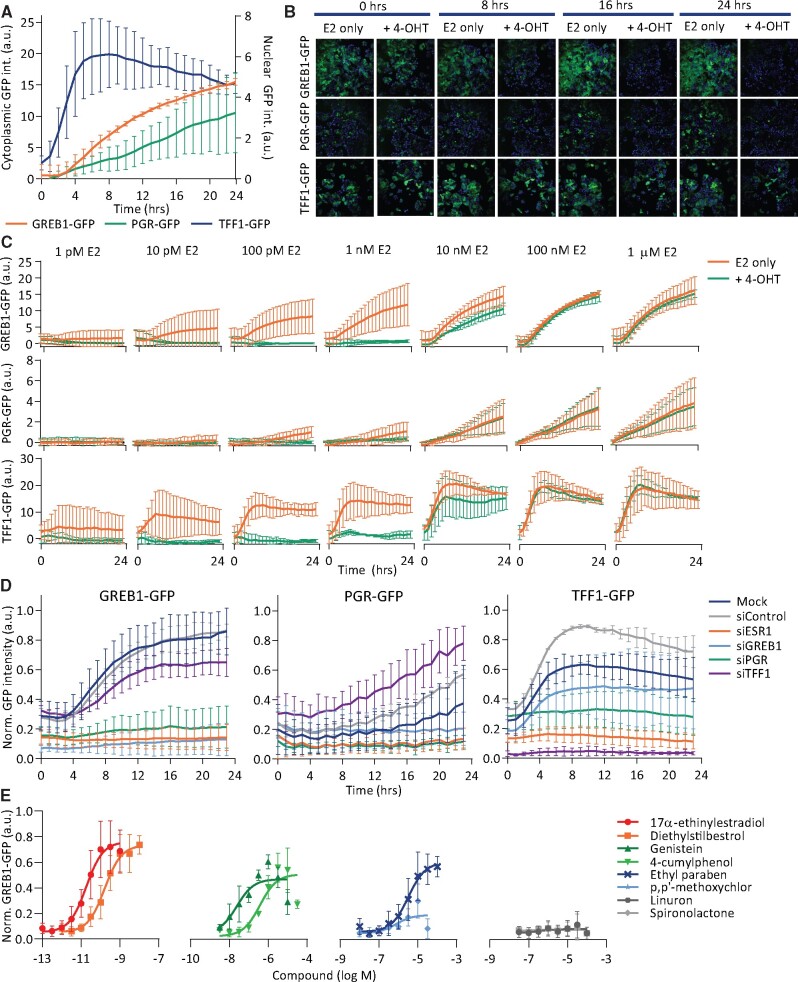
Figure 4.
GREB1-GFP, PGR-GFP, and TFF1-GFP reporters demonstrate different activation dynamics upon exposure to estrogenic compounds. A, Mean integrated GFP intensity in the cytoplasm for GREB1 and TFF1 (left Y-axis) and mean integrated nuclear PGR-GFP intensity (right Y-axis) of reporters exposed to 100 nM E2 and imaged every hour up to 24 h. Normalized to DMSO. B and C, Mean integrated GFP intensity of reporters exposed to different concentrations E2 with or without 100 nM 4-OHT and imaged every hour up to 24 h. Normalized to DMSO. D, Min-max normalized integrated GFP intensity of reporters, 48 h after siRNA transfection followed by DMSO or 1 nM E2 exposure and imaged every hour up to 24 h. E, Min-max normalized integrated GFP intensity of GREB1-GFP reporter after 48 h exposure to chemicals with different estrogenic activity (n = 3 − 6).

