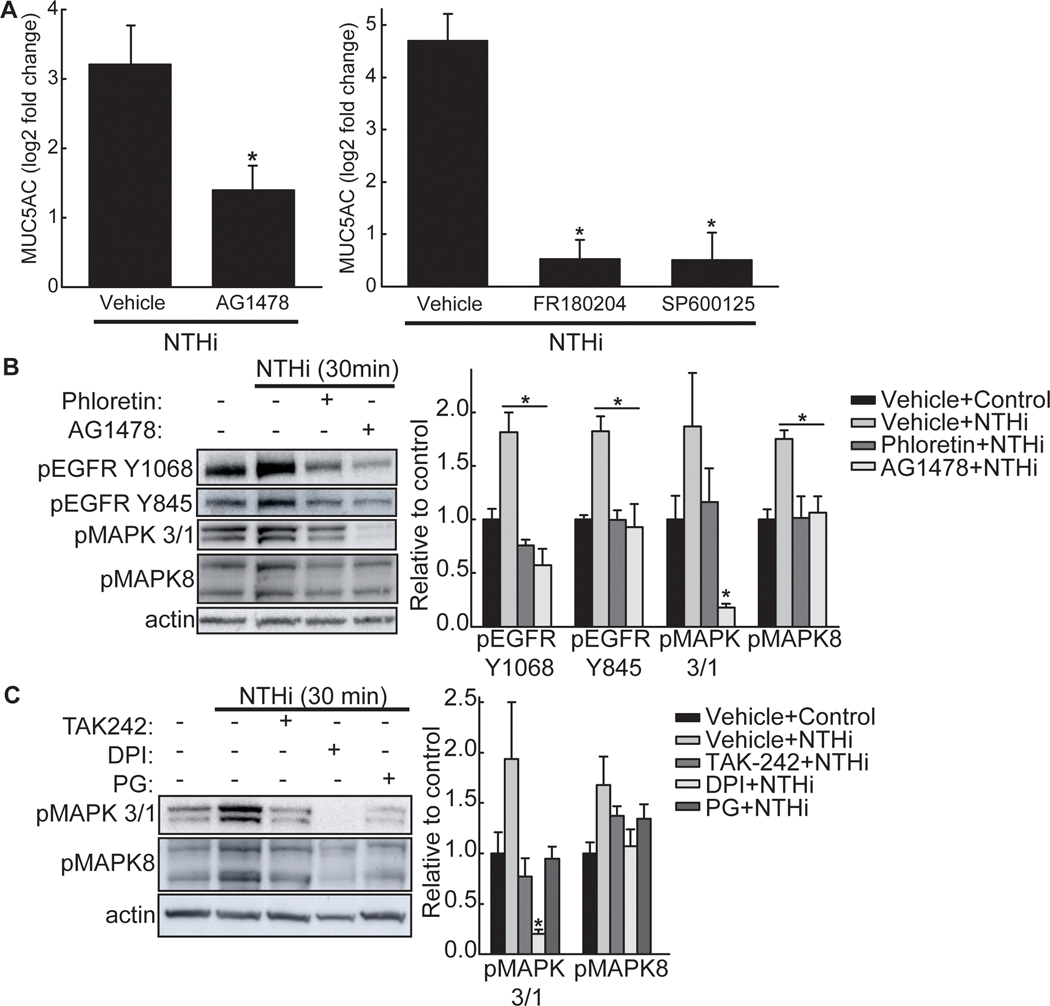
Figure 3. Phloretin inhibits NTHi-induced mucin 5AC, oligomeric mucus/gel-forming (MUC5AC) as mediated by epidermal growth factor receptor (EGFR)-mitogen-activated protein kinase (MAPK) signaling.
A. Inhibition of EGFR phosphorylation, MAPK3/1, and MAPK8 reduces NTHi-induced MUC5AC. NCI-H292 cells were incubated (1h) with vehicle or (Left panel) 1 μM AG-1478, an EGFR kinase inhibitor, or (Right Panel) 30 μM FR180204, a MAPK3/1 (aka ERK1/2) inhibitor, or 100 μM SP600125, a MAPK8 (aka JNK) inhibitor and stimulated with NTHi (8h). MUC5AC and RPL32 transcripts were measured by RT-qPCR. Values (mean ± SEM, n=6–12) are log2 fold change of MUC5AC mRNA normalized to RPL32 relative to vehicle control treated cells. *Significantly different (p<0.05) compared to NTHi alone treated cells as determined by ANOVA followed by Tukey’s multiple comparison method. B. NTHi increases phosphorylation of EGFR, MAPK3/1, and MAPK8, which phloretin and AG-1478 inhibits. NCI-H292 cells were pretreated with vehicle, 100 μM phloretin, or 1 μM AG-1478 (1 h) and exposed to NTHi (30 min). (Left Panel) Cell protein extract was collected and immunoblotted with antibodies for β-actin (protein loading control) or phosphorylated EGFR, MAPK3/1, or MAPK8 protein. (Right Panel) Values (mean ± SEM, n=4) are fold change in protein expression relative to vehicle control normalized to the β-actin control. *Significantly different (p<0.05) from NTHi treated cells as determined by ANOVA followed by Tukey’s multiple comparisons method. C. Inhibition of TLR4 or ROS inhibits downstream NTHi-induced MAPK signaling. NCI-H292 cells were incubated (1h) with 30 μM TAK-242, a TLR4 inhibitor, 10 μM diphenyleneiodonium (DPI), a NADPH oxidase inhibitor, or 100 μM propyl gallate (PG), a ROS scavenger, and stimulated with NTHi (30 min). (Right Panel) Values (mean ± SEM, n=4) are fold change in protein expression relative to vehicle control normalized to the β-actin control. *Significantly different (p<0.05) from NTHi treated cells as determined by ANOVA followed by Tukey’s multiple comparisons method. Tests were performed on ≥2 occasions.

