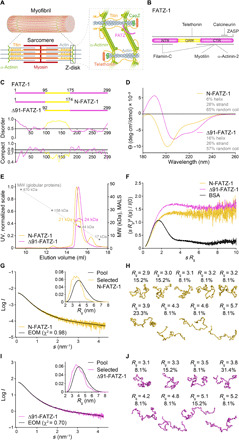
Fig. 1. Proteins of the FATZ family display intrinsic disorder.

(A) Schematics of the striated muscle sarcomere and close-up view of F-actin/α-actinin/FATZ interactions in Z-disk. (B) Schematics of the FATZ-1 interactome and binding sites reported to date. (C) Schematics of the main FATZ-1 constructs, along with their amino acid boundaries and domain composition. Predicted disordered regions (above 0.5) and compactness (above 0.8) are shown below. (D) Circular dichroism (CD) spectra of N-FATZ-1 and Δ91-FATZ-1, along with calculated secondary structure content. (E) Size exclusion chromatography (SEC)–multiangle light scattering (MALS) analysis of N-FATZ-1 and Δ91-FATZ-1, yielding molecular weights (MWs) of 21 and 24 kDa, respectively. Elution volumes were lower than anticipated relative to globular standards [thyroglobulin (670 kDa), γ-globulin (158 kDa), ovalbumin (44 kDa), and myoglobin (17 kDa)], corresponding to MWs of 50 and 46 kDa for N-FATZ-1 and Δ91-FATZ-1, respectively. UV, ultraviolet. (F) Dimensionless Kratky plots of N-FATZ-1 and Δ91-FATZ-1, as well as of globular bovine serum albumin (BSA) (SASBDB code SASDFQ8). Experimental SEC–small-angle x-ray scattering (SAXS) data of N-FATZ-1 (G) and Δ91-FATZ-1 (I) and corresponding fit to the data of selected ensembles obtained from Ensemble Optimization Method (EOM) (43, 44). Rg distributions of selected ensembles relative to the distribution of a random pool are shown in the insets. Model representatives of the selected EOM ensembles for N-FATZ-1 (H) and Δ91-FATZ-1 (J), along with their Rg (in nanometers) and volume fractions (in percentage). See also figs. S1 to S5 and tables S1 and S2.
