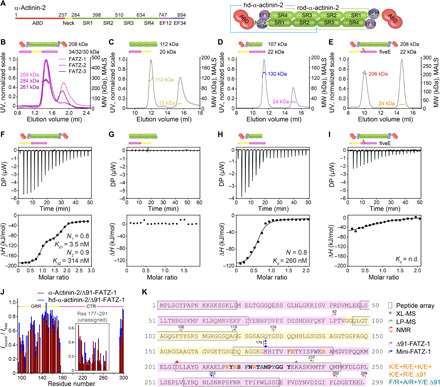
Fig. 2. FATZ-1 forms a tight 2:1 complex with α-actinin-2 dimer via multiple binding sites.

(A) Schematics of the α-actinin-2 constructs, along with their amino acid boundaries and domain composition. SEC-MALS analysis for the interaction of FATZ-1, FATZ-2, and FATZ-3 with α-actinin-2 (B), N-FATZ-1 with rod-α-actinin-2 (C), Δ91-FATZ-1 with hd-α-actinin-2 (D), and fiveE Δ91-FATZ-1 mutant with α-actinin-2 (E). ITC analysis for the interaction of Δ91-FATZ-1 with α-actinin-2 (F), N-FATZ-1 with rod-α-actinin-2 (G), Δ91-FATZ-1 with hd-α-actinin-2 (H), and fiveE Δ91-FATZ-1 mutant with α-actinin-2 (I). n.d., not determined. (J) 1H-15N HSQC signal intensity ratio of 15N Δ91-FATZ-1 bound/free, mapping FATZ-1 primary binding site for α-actinin-2. Unassigned part in FATZ-1 is boxed, and residues are plotted at a random position. (K) Sequence of FATZ-1 showing multiple interaction sites for α-actinin-2 as determined from the peptide array (squared residues), XL-MS (star), LP-MS (residues delimited by arrows), and NMR (arrows). Residues matching the strongest signal peptide in the peptide array are shown in bold. Boundaries for Δ91-FATZ-1 and mini-FATZ-1 are delimited by arrows. Mutations within fiveE Δ91-FATZ-1 and RRE Δ91-FATZ-1 are indicated in orange and dark cyan, respectively. See also figs. S5 to S9 and tables S1, S3, and S7 for statistical analysis and table S8. DP, differential power.
