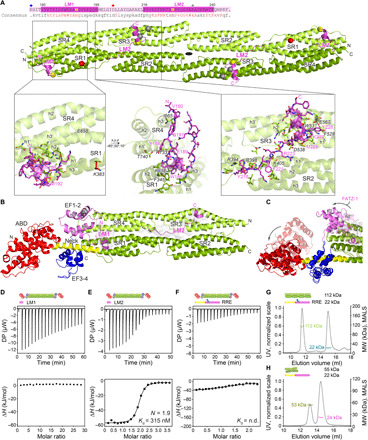
Fig. 3. Crystal structures of α-actinin-2/FATZ-1 reveal two linear binding motifs in FATZ-1.

(A) Crystal structure of rod-α-actinin-2/mini-FATZ-1 (in green/magenta), along with the determined FATZ-1 consensus sequence (35 to 80% and 60 to 84% pairwise sequence identity for LM1 and LM2, respectively). Cross-linked residues are indicated by blue, red, and gray stars/balls/sticks on the sequence/structure. Identified Se-Mets are shown in yellow. The rod-α-actinin-2 dimer is assembled through a crystallographic twofold axis between symmetry mates (black circle). Interacting residues (rod-α-actinin-2 in italics), along with helices from SR1/SR2 (h1, h2, and h3) and SR3/SR4 (h1′, h2′, and h3′), are shown in close-up views. (B) Crystal structure of hd-α-actinin-2/Δ91-FATZ-1 (LM1 and LM2 as magenta cartoon and transparent gray surface; hd-α-actinin-2 color-coded as in Fig. 2A). (C) Comparison of unbound [Protein Data Bank (PDB) code 4D1E] and bound (this work) hd-α-actinin-2. ABD and EF1-2 of unbound hd-α-actinin-2 are shown with transparency. ITC analysis for the interaction of LM1 peptide with α-actinin-2 (D), LM2 peptide with α-actinin-2 (E), and RRE Δ91-FATZ-1 mutant with α-actinin-2 (F). SEC-MALS analysis for the interaction of RRE Δ91-FATZ-1 mutant with rod-α-actinin-2 (G) and Δ91-FATZ-1 with E. histolytica rod-α-actinin-2 (H). See also figs. S6 to S11 and S18, tables S1 and S3 to S7, and movie S1.
