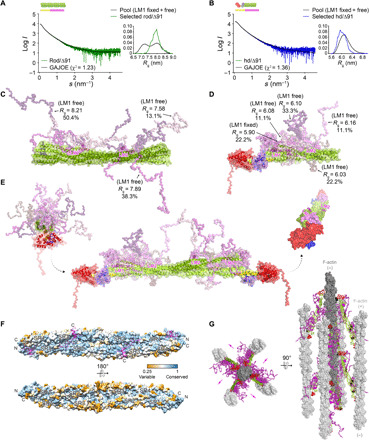
Fig. 4. FATZ-1 forms a fuzzy complex with α-actinin-2 resulting in a polar architecture of the complex.

Experimental SAXS data of rod-α-actinin-2/Δ91-FATZ-1 (A) and hd-α-actinin-2/Δ91-FATZ-1 (B), with the corresponding model fits to the data of the selected ensembles. GAJOE, Genetic Algorithm Judging Optimisation of Ensembles. Flexible regions of Δ91-FATZ-1, nonvisible in our determined crystal structures, were generated with EOM (43) keeping LM1 either fixed or free (10,000 models for each). Selected ensemble model representatives for rod-α-actinin-2/Δ91-FATZ-1 (C) and hd-α-actinin-2/Δ91-FATZ-1 (D) (color code as in Fig. 2A), along with their Rg and volume fractions within the ensemble. (E) Integrative model of fuzzy α-actinin-2/Δ91-FATZ-1 built using x-ray crystallography and SAXS models of hd-α-actinin-2/Δ91-FATZ-1. Rotation for LM2 helices of bound FATZ-1 molecules with respect to each other, as well as torsional twist in the rod along the longitudinal α-actinin-2 axis, is shown in the right inset (FATZ-1 flexible parts are omitted for clarity). (F) Surface of the rod-α-actinin-2/FATZ-1 structure showing the sequence conservation of α-actinin interacting residues for FATZ-1 (alignment done using 1505 α-actinins from vertebrates). (G) Model of F-actin/α-actinin-2/FATZ-1 (F-actin in light and dark gray) based on a cryo–electron tomography structure of the Z-disk (47) and our integrative model. See also figs. S11 to S13, tables S1 and S2, and movies S1 to S3.
