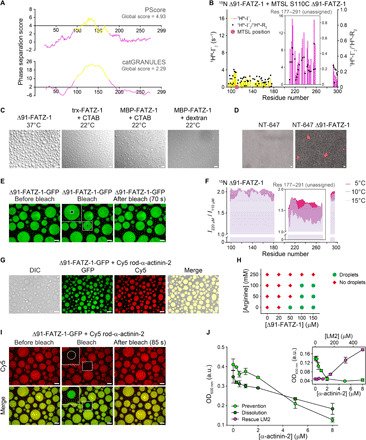
Fig. 5. FATZ-1 interacts with itself and phase-separates in vitro.

(A) Phase-separation prediction for FATZ-1 using PScore and catGRANULE servers (NTR and CTR in magenta and GRR in yellow). (B) PRE-rate (1HN-Г2) of 15N Δ91-FATZ-1 upon addition of MTSL (14N) S110C Δ91-FATZ-1 (difference of diamagnetic 1HN-R2 and paramagnetic 1HN-R2; bars, left y axis), along with (1HN-Г2)/(1HN-R2 dia) ratio of PRE rate divided by diamagnetic transverse relaxation rate (points, right y axis). (C) Differential interference contrast (DIC) microscopy of FATZ-1 condensates when incubated at 22° or 37°C. CTAB, cetyl-trimethylammonium bromide. (D) Fluorescence image of NT-647–labeled Δ91-FATZ-1 condensates. (E) FRAP of Δ91-FATZ-1-GFP. Photobleached area is circled in the close-up view. (F) 1H-15N HSQC signal intensity ratio of 15N Δ91-FATZ-1 at concentration of 220 μM/110 μM measured at increasing temperatures. (G) DIC/fluorescence images of Δ91-FATZ-1-GFP mixed with Cy5 rod-α-actinin-2. (H) Phase diagram of Δ91-FATZ-1 in function of protein and arginine concentration. (I) FRAP of Cy5 rod-α-actinin-2 mixed with Δ91-FATZ-1-GFP. Photobleached area is circled in the close-up view. Scale bars, 10 μm in all images. (J) Turbidity assay of Δ91-FATZ-1 with increasing concentrations of α-actinin-2. Prevention and dissolution done by triggering phase separation after mixing proteins and by adding α-actinin-2 after forming condensates, respectively. Rescue of phase separation by addition of LM2 peptide is shown in the right inset. Data taken after 14 to 20 min of reaction, represented as means ± SD (n = 3). See also figs. S14 to S16 and table S7 for statistical analysis, table S8, and movies S4 to S8. OD600 nm, optical dentisy at 600 nm; a.u., arbitrary units.
