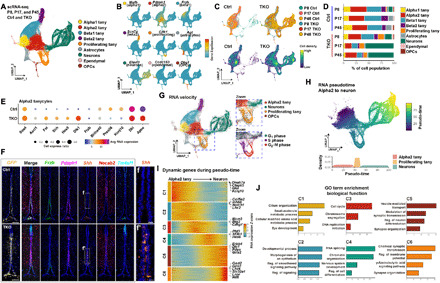
Fig. 3. scRNA-seq analysis of control and NFI-deficient tanycytes.

(A) Aggregate UMAP plot of scRNA-seq data from control and NFI-deficient GFP+ tanycytes and tanycyte-derived cells isolated at P8, P17, and P45. Cell types are indicated by color shading. tany, tanycytes. (B) Distribution of cell type–specific marker expression on aggregate UMAP plot. (C) Distribution of cells by age and genotype on aggregate UMAP plot. (D) Percentage of each cell type by age and genotype. (E) Dot plot showing differentially expressed genes (DEGs) in Nfia/b/x-deficient alpha2 tanycytes. Avg, average. (F) HiPlex analysis for tanycyte subtype–specific markers and enhanced Shh expression in a subset of Pdzph1+ alpha2 tanycytes. Necab2+ alpha1 tanycytes and Tm4sf1+ ependymal cells are shown for reference. (G) RNA velocity analysis indicating differentiation trajectories in tanycytes and tanycyte-derived cells. Insets highlight proliferating tanycytes and TDNs. (H) Pseudo-time analysis of differential gene expression in alpha2 tanycytes, proliferating tanycytes and TDNs. (I) Heatmap showing DEGs over the course of tanycyte-derived neurogenesis. (J) Gene ontology (GO) analysis of DEGs in (I), with enrichment shown at −log10 P value. Scale bars, 100 μm (F), and 20 μm (f and f′).
