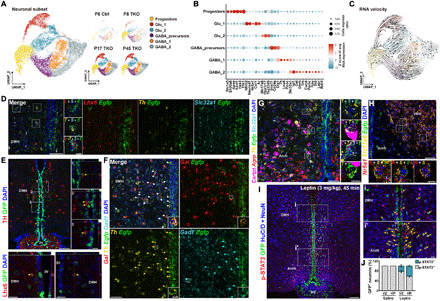
Fig. 6. Identification of selective markers of TDNs.

(A) UMAP plot showing major clusters of tanycyte-derived neuronal subset, separated by age and genotype. (B) Dot plot showing major subtype-specific markers of TDNs. (C) RNA velocity analysis indicates differentiation trajectories for TDNs. (D) smfISH analysis and (E) immunohistochemistry demonstrates expression of Th and Lhx6 in Egfp+ TDNs in Nfia/b/x-deficient mice. (F) smfISH analysis of Gal, Gad1, and Th in Egfp+ TDNs in Nfia/b/x-deficient mice. (G) Cart, Agrp, Slc32a1, and Th expression in Egfp+ TDNs in Nfia/b/x-deficient mice. (H) Nr5a1 and Slc17a6 expression in Egfp+ TDNs in Nfia/b/x-deficient mice. All insets are enlarged images of examples of colocalization [white boxes in (D) to (H)]. (I) pStat3 staining 45 min after intraperitoneal administration of leptin (3 mg/kg) in Nfia/b/x-deficient mice (n = 3 mice). Arrows indicate GFP+/pStat3+ TDNs. Insets show higher magnification images in DMH (i) and ArcN (i′). (J) Fraction of pStat3-positive TDNs in VZ and HP after leptin administration. pStat3 was not induced in saline-injected mice (n = 2 mice). Scale bars, 50 μm (D, F, G, and H), 10 μm [insets in (D), (F), (G), and (H)], 100 μm (E and I), and 20 μm [high-magnification images in (E)].
