
Fig. 8. TDNs show distinct membrane excitability and synaptic activity and respond to physiological stimuli.
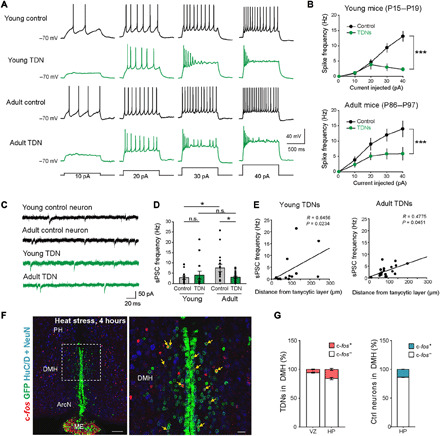
(A) Representative voltage traces recorded from control and TDNs from young and adult mice evoked by depolarizing current steps as indicated. (B) The current-spike frequency relationships measured from control and TDNs from young (top) and adult mice (bottom). The current-frequency relationship was significantly different between TDNs and control neurons at both ages [young control neurons, 14 cells from four mice; young TDNs, 13 cells from four mice; P < 0.0001, two-way analysis of variance (ANOVA); adult control neurons, 16 cells from six mice; adult TDNs, 18 cells from six mice; P = 0.0001, two-way ANOVA]. (C) Representative traces of spontaneous postsynaptic currents (sPSCs). (D) Summary graphs of sPSC frequency (young control neurons, 14 cells from four mice, 2.85 ± 0.74 Hz; young TDNs, 13 cells from four mice, 4.07 ± 1.93 Hz; P = 0.2983, Mann-Whitney U test; adult control neurons, 16 cells from six mice, 7.56 ± 1.82 Hz; adult TDNs, 18 cells from six mice, 2.98 ± 0.54 Hz; P = 0.0324, Mann-Whitney U test). (E) Positive correlation between the distance from the tanycytic layer for each TDN and its sPSC frequency in both young (left: 12 cells from four mice, P = 0.0234, Spearman’s Rho correlation) and adult (right: 18 cells from six mice, P = 0.0451, Spearman’s rho correlation) mice. (F) Four-hour heat stress (38°C) selectively induced the c-fos expression in TDNs in DMH (higher magnification inset shown in right). (G) Fraction of c-fos+ TDNs in VZ and HP of DMH and fraction of all c-fos+ and c-fos− neurons in DMH (n = 3 mice). PH, posterior hypothalamus. Scale bars, 100 μm (F) and 20 μm (F, inset). *P < 0.05 and ***P < 0.001.