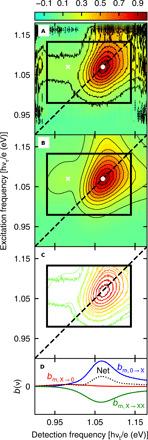
Fig. 2. Comparison between experimental and fit Einstein B coefficient 2D spectra for the partially ligand-covered PbS quantum dot sample.

The color bar at the top is used to show signal as a fraction of maximum signal. (A) Experimental 2D spectra with black contours at 10 to 90% of maximum. The rectangle encloses the fitted region. The dashed line shows the diagonal, the white dot marks the absorption-〈b〉 maximum, and the white cross marks the emission-〈b〉 maximum. (B) Least squares fit to the 2D spectrum using eq. S9. (C) Overlaid 10 to 90% contours of the experimental (2.4% noise) and fit (smooth) 2D spectra. (D) The net signal (black dotted curve) and three dynamical contributions for the most probable quantum dot size and bandgap (m): positive reduced exciton absorption (blue curve), positive exciton stimulated emission (red curve), and negative exciton to bi-exciton absorption (green curve).
