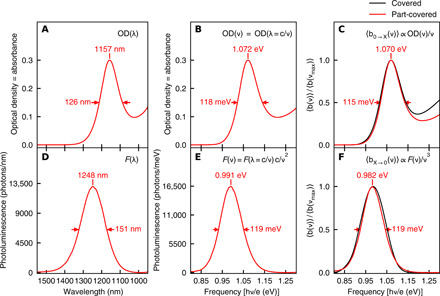
Fig. 4. Transformation of ensemble absorbance and PL spectra as a function of wavelength into absorption and stimulated emission Einstein B coefficient lineshapes as a function of frequency.

The 1S-1S maximum and FWHM are marked in each panel. (A) Optical density (= decadic absorbance) spectrum as a function of wavelength. (B) Optical density spectrum as a function of frequency. (C) Einstein B absorption coefficient lineshape. (D) PL (= spontaneous emission) spectrum as a function of wavelength. (E) Spontaneous emission spectrum as a function of frequency 〈aX → 0(ν)〉 ∝ F(ν). (F) Einstein B stimulated emission coefficient lineshape. The right column compares the ensemble-averaged Einstein B coefficient absorption lineshapes (C) and stimulated emission lineshapes (F) for the ligand-covered (black curve) and part-covered (red curve) PbS nanocrystals. Each lineshape is peak normalized.
