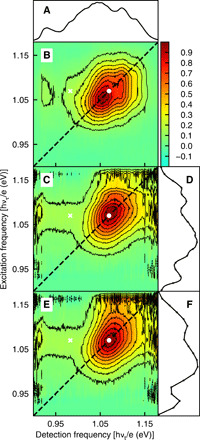
Fig. 5. Transformation of experimental attenuated 2D spectra into Einstein B 2D spectra.

(A) Probe or detection pulse spectrum measured with the InGaAs spectrograph. (B) Real-valued 2D correlation spectrum of the part-covered sample at 1-ps waiting time. This attenuated 2D spectrum is filtered by the pulse spectra and distorted by sample absorption. (C) Einstein B 2D spectrum from Eq. 23 using division by the probe pulse spectrum along both frequency axes. (D) Transmitted probe pulse spectrum with frequency sampling points corresponding to sampling points of the 2D spectrum marked as circles. (E) Einstein B 2D spectrum from Eq. 23 using division by the spectrograph probe pulse spectrum along the detection axis and the interferogram-detected pump pulse-pair spectrum along the excitation axis. (F) Excitation pulse-pair spectrum from the Fourier transform of the excitation pulse-pair interferogram collected during the 2D experiment – frequency sampling points (circles) match the sampling points of the 2D spectrum. White dots on 2D spectra mark the 1S-1S absorption lineshape maximum; white diagonal crosses mark the 1S-1S stimulated emission lineshape maximum. Black contours are at 10% intervals and color changes are at 1% intervals (color bar at top right).
