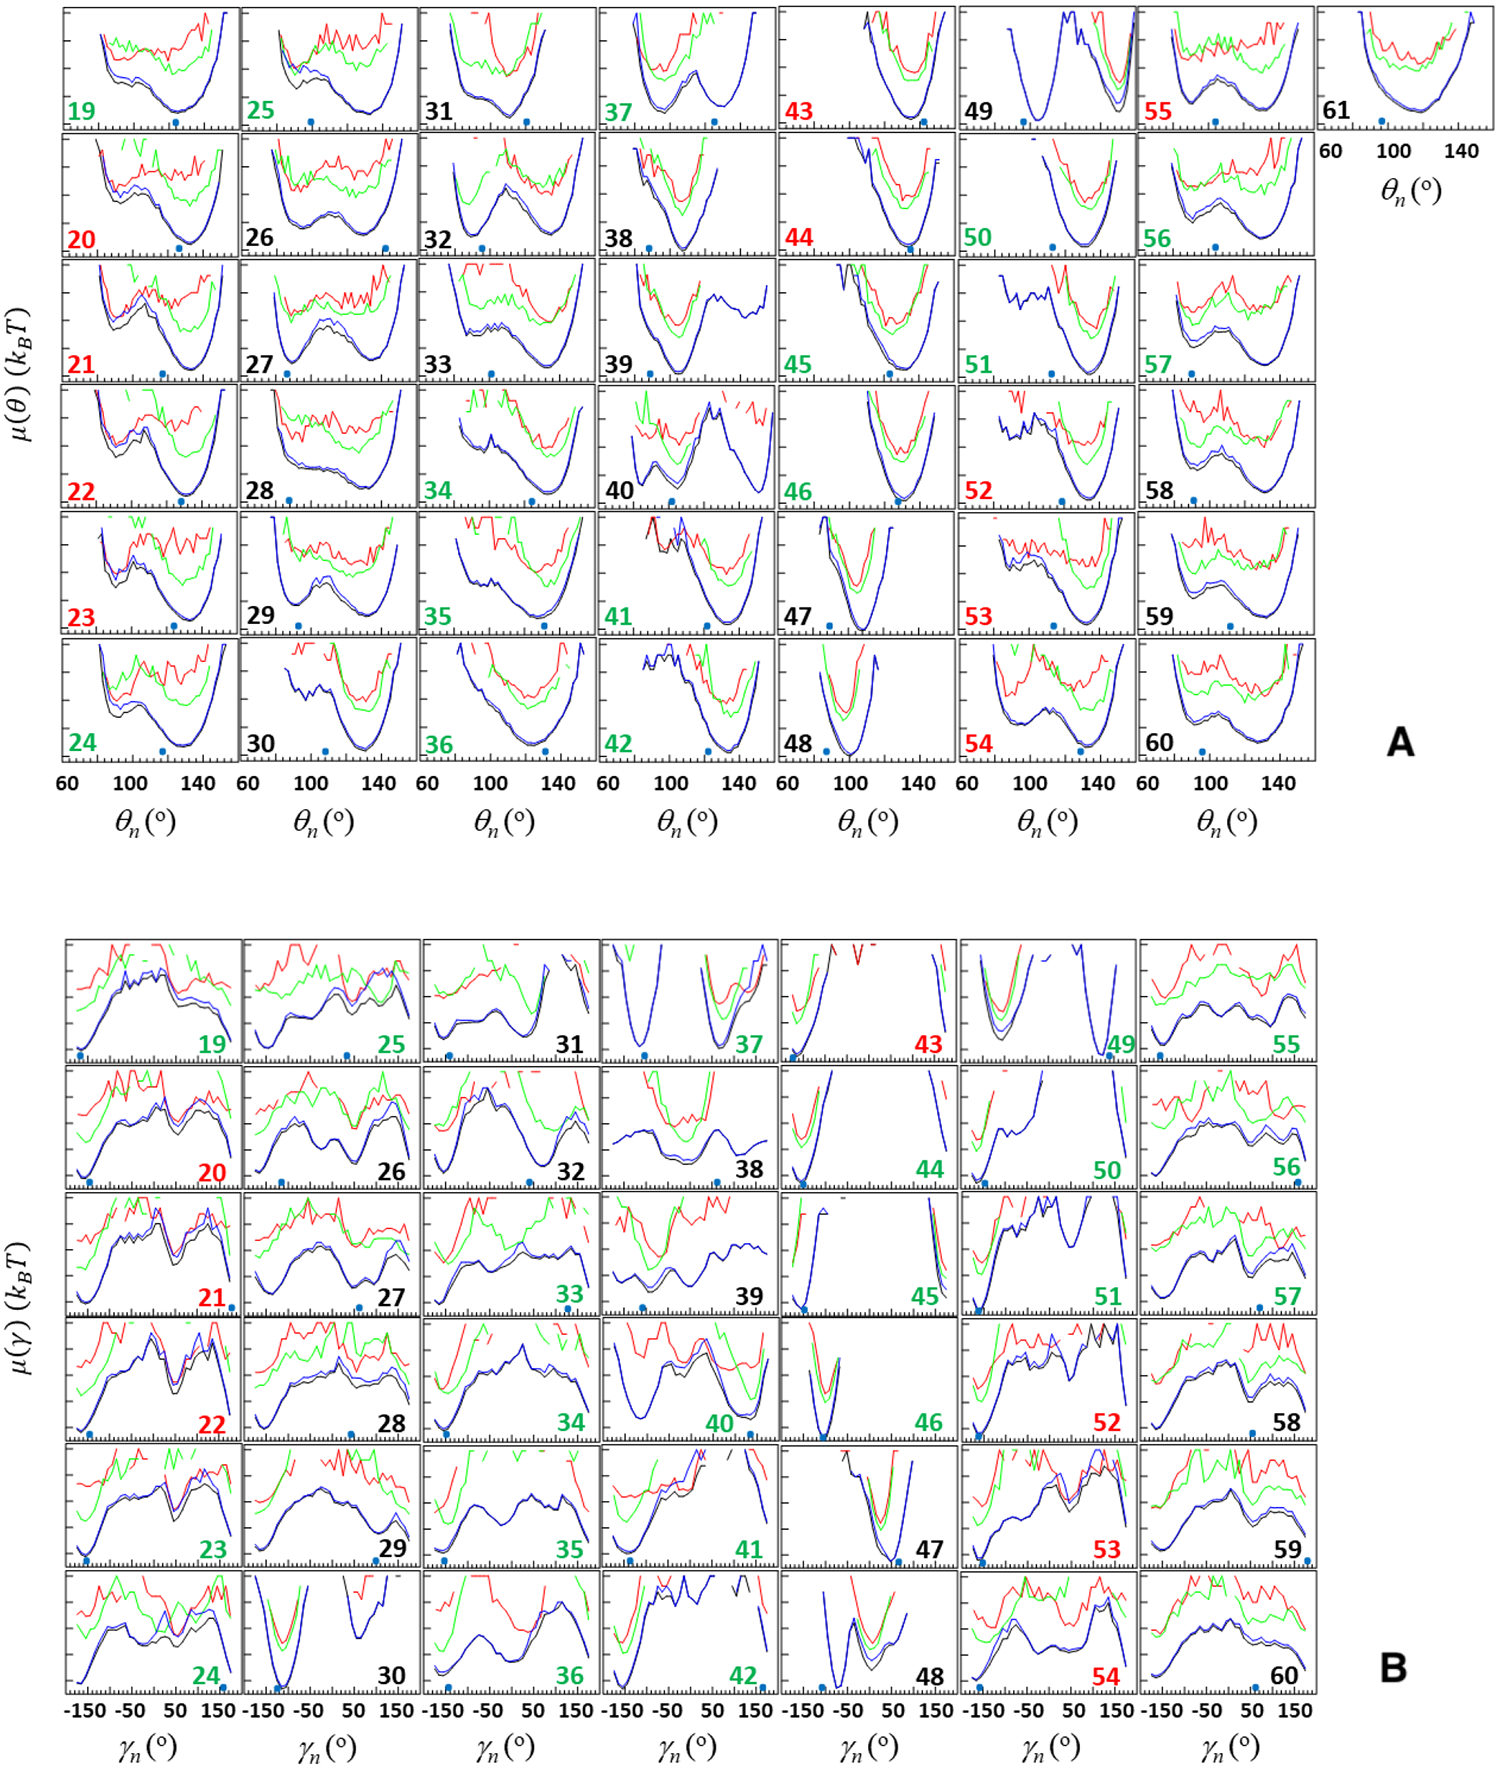
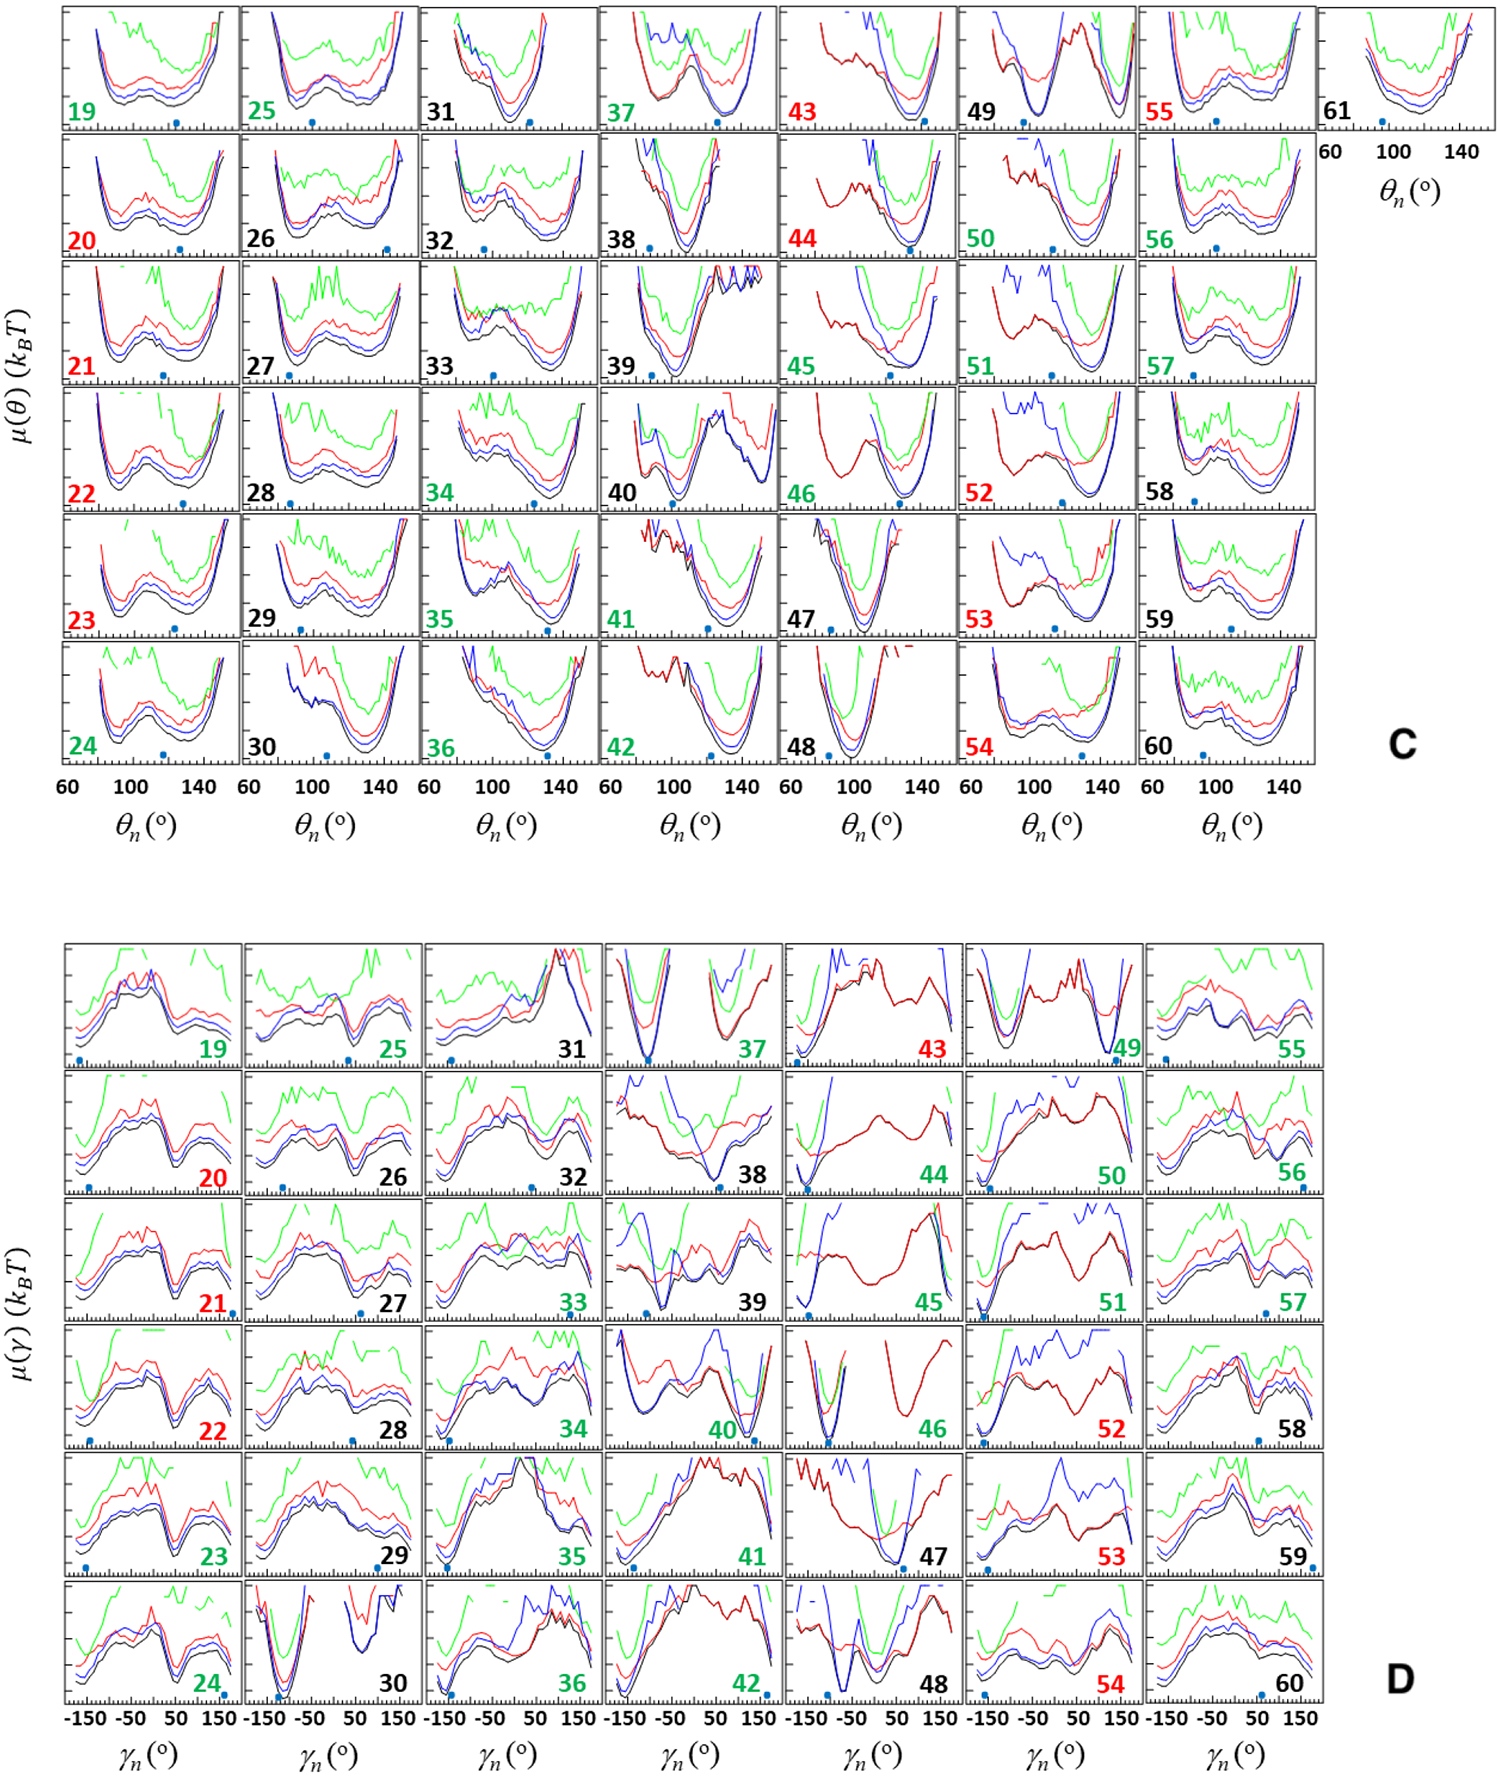
Figure 8.


Free-energy profiles (FEPs), μ(θ) and μ(γ), along the θ and γ angles for the first folding (panels A and B, respectively) and second folding (panels C and D, respectively) MD trajectories of the pT37pT46 4E-BP218–62. Red, green, blue and black curves correspond to FEPs computed over the following time intervals: time from the beginning of the trajectory until the system reaches the folded state (red), time that the system spends in the folded state (green), time after jumping from the folded state until the end of the trajectory (blue), and over the entire MD trajectories (black). The black numbers pertain to FEPs along the θ and γ angles which include only residues of the loops and ends; the red numbers pertain to FEPs along the θ and γ angles which include only residues of β-strands; the green numbers pertain to FEPs along θ and γ angles which include the residues from both loop and β-strands (and 310 helix) or from both ends and β-strands. The NMR-derived structural data (small blue circles at the bottom of each panel) are computed from the first model of the PDB ID code 2MX4.9
