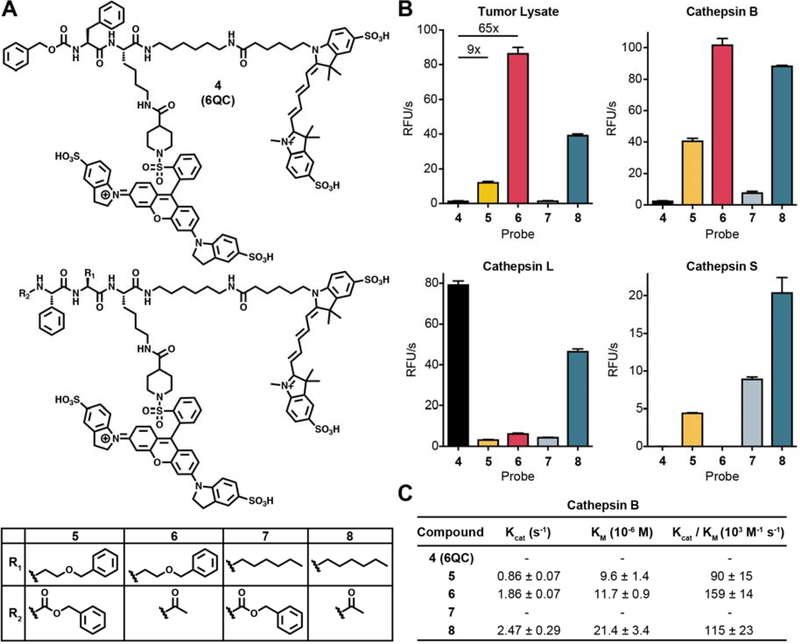
Fig. 2: Conversion of substrate screening specificities into fluorescently quenched imaging probes.
(A) Structure of the original fluorescently-quenched substrate probe 6QC compared to probes 5–8 that contain the optimized P2, P3 and N-terminal capping groups. (B) Cleavage rates of probes 4–8 when incubated with 4T1 murine breast tumor lysate at pH 5 (top left) or with purified cathepsin B (top right), cathepsin L (bottom left) or cathepsin S (bottom right). Values are plotted as mean value ± SD. n=3. (C) Kinetic parameters for the indicated probes for purified cathepsin B at pH 5. Values could not be obtained for probes 4 and 7 due to overall low activity.

