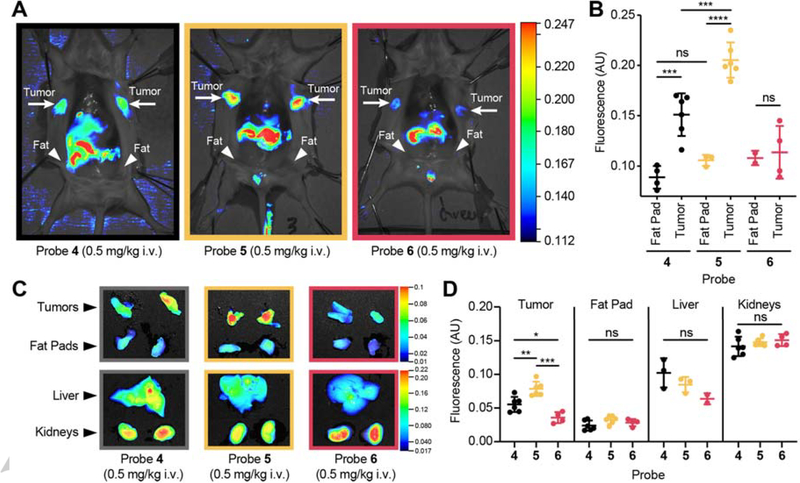
Fig. 4: Imaging of breast tumors with optimized fluorescently quenched substrate probes.
(A) Fluorescent signal in tumor bearing mice. Representative images of mice injected with probes 4–6 (0.5 mg/kg in 10% DMSO + 30% PEG-400, 3 h). Mice have been splayed to show mammary tumors. Location of tumors, and healthy fat pads are indicated (B) Quantification of fluorescence in healthy mammary fat pad and tumor tissue in 4T1 breast cancer mice injected with probes 4–6 (0.5 mg/kg in 10% DMSO + 30% PEG-400, 3 h, nfat= 3, ntumor= 6, Student’s t-test). (C) Representative ex vivo images of fluorescent signal in tumor, fat pad, liver, and kidneys for animals injected with probes 4–6. (D) Quantification of ex vivo fluorescence in tumor, fat pad, liver, and kidneys in animals injected with probes 4–6 (ntumor= 6, nfat= 6, nliver= 3, nkidney= 6, Student’s t-test).

