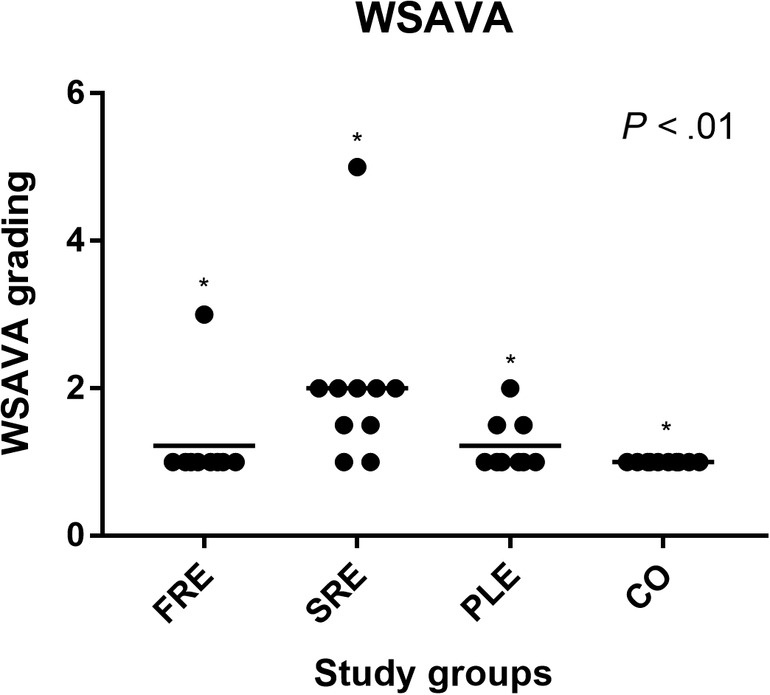
FIGURE 4.

World Small Animal Veterinary Association histology scores for each study group, FRE group (n = 9); SRE group (n = 10); PLE (n = 9); and CO (n = 10). The horizontal lines represent the mean score in each study‐group. Significant differences were found between all groups of dogs. *P < .01
