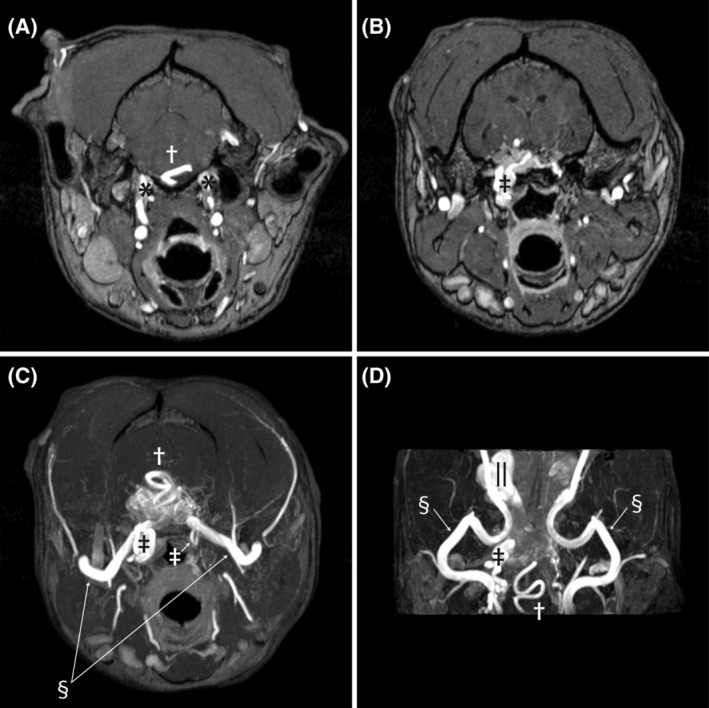
FIGURE 2.

Pretreatment time‐of‐flight sequences demonstrating abnormal vasculature. Image A is at the level of the petroccipital fissure as the internal carotid arteries enter the calvaria (*). The engorged basilar artery is indicated by the cross. Image B is at the level of the foramen lacerum, where the internal carotid arteries normally exit the calvaria and make a hairpin turn and re‐enter the calvaria. The internal carotid artery on the right side is enlarged (double dagger), tortuous, and continuous with the nest of vessels comprising the AVM. Image C is a transverse maximum intensity time‐of‐flight image that shows the confluence of multiple abnormal vessels within the calvaria. The internal carotid arteries can be seen as they make the hairpin turn at the foramen lacerum (double daggers). The left is normal in size and makes a simple loop, while the right side is enlarged and tortuous. The maxillary arteries are bilaterally visible (double S) as they enter the calvaria. The basilar artery can be seen as it dives into the AVM (cross). Image D is a dorsal plane time‐of‐flight image at the base of the skull. The maxillary arteries (double S) can be seen along their length as they course from laterally toward midline where they go through the alar canals and then extend rostrally to the retrobulbar space. The enlarged right internal carotid artery is visible (cross) where it makes the hairpin turn at the foramen lacerum. The serpentine basilar artery is indicated by the cross. Finally, the dilated ophthalmic plexus on the right (||) is visible as the saccular dilatation
