
FIGURE 2.
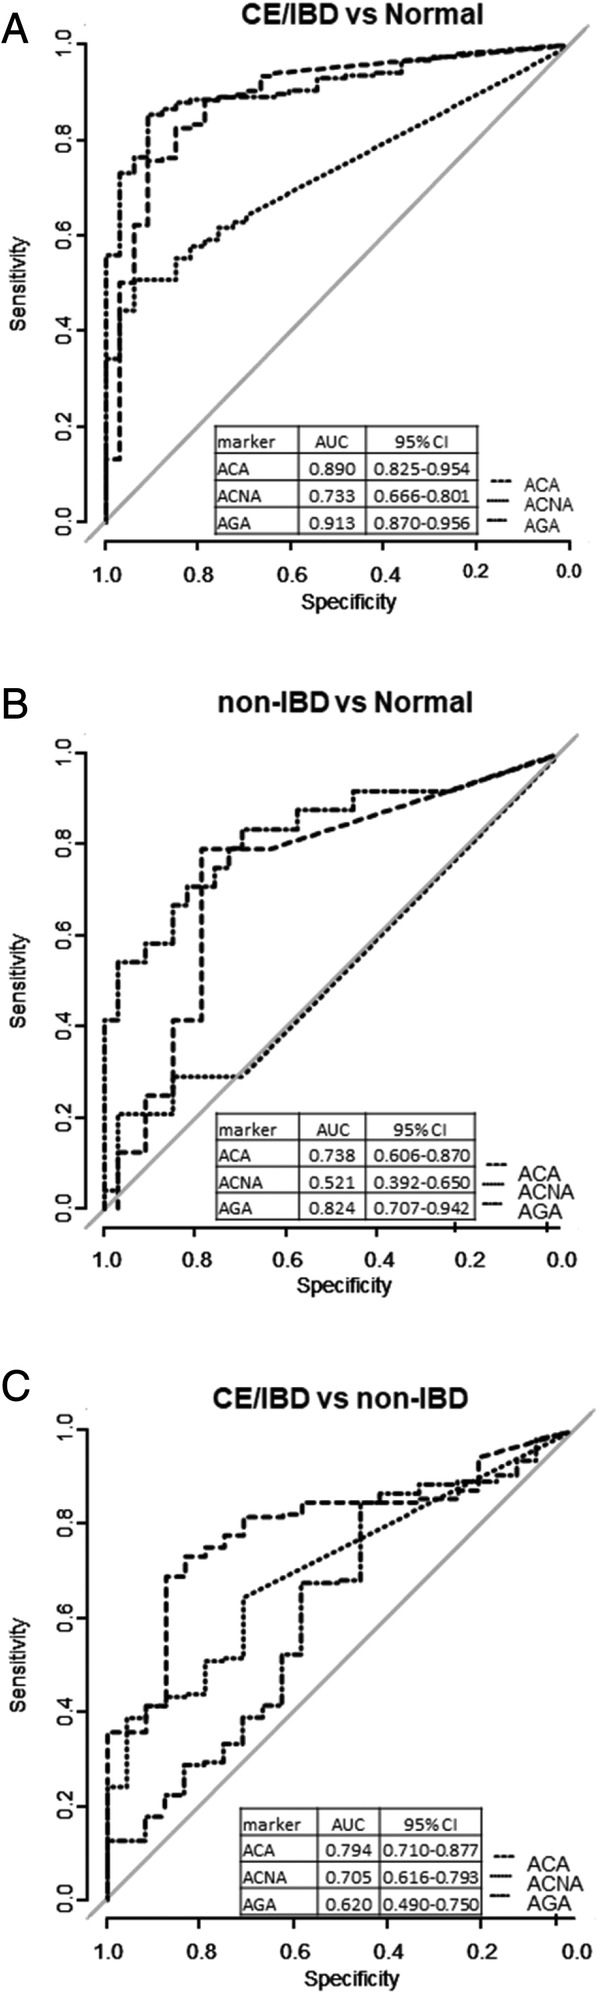
Receiver operator characteristics curves for discriminating the normal vs CE/IBD cohorts, A, normal vs non‐IBD, B, and non‐IBD vs CE/IBD, C, for continuous serological markers and autoantibodies. Area under the curve (AUC) represents the discriminating performance of each marker. All AUC values for each of the markers when tested and their 95% confidence intervals as determined with 2000 stratified bootstrap replicates. 19 CE, chronic enteropathies; IBD, inflammatory bowel disease