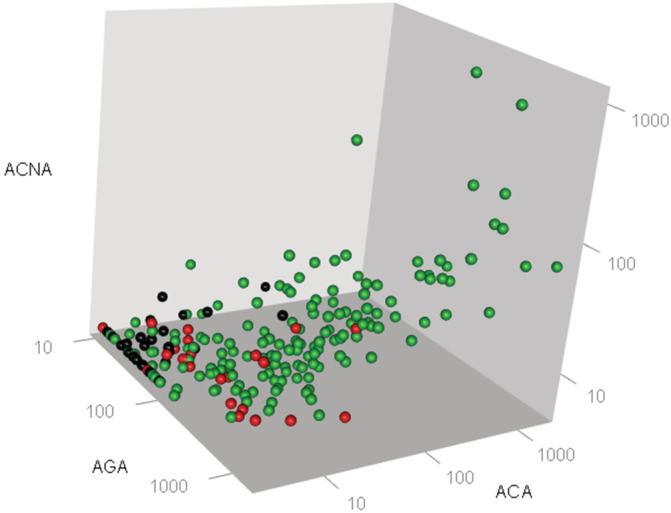
FIGURE 3.

3D scatter graphs representations of the seropositivity titers to OmpC (ACA), calprotectin (ACNA), and gliadin‐derived peptides (AGA) obtained from serum samples collected from the different cohorts of dogs enrolled for the field study. Each dot represents the combined marker titer set obtained from the serum sample analysis from each dog enrolled in this analysis. Cohorts are defined by the color of the dots as outlined in the Figure. Black (n = 33) are normal; red (n = 24) non‐IBD; green (n = 157) CE/IBD. The 3‐axes plot can separate graphically each cohort. The algorithm developed can place a given sample into each of the different cohorts based on the 3 input values. CE, chronic enteropathies; IBD, inflammatory bowel disease
