. 2020 Aug 5;11(47):12721–12730. doi: 10.1039/d0sc03246h

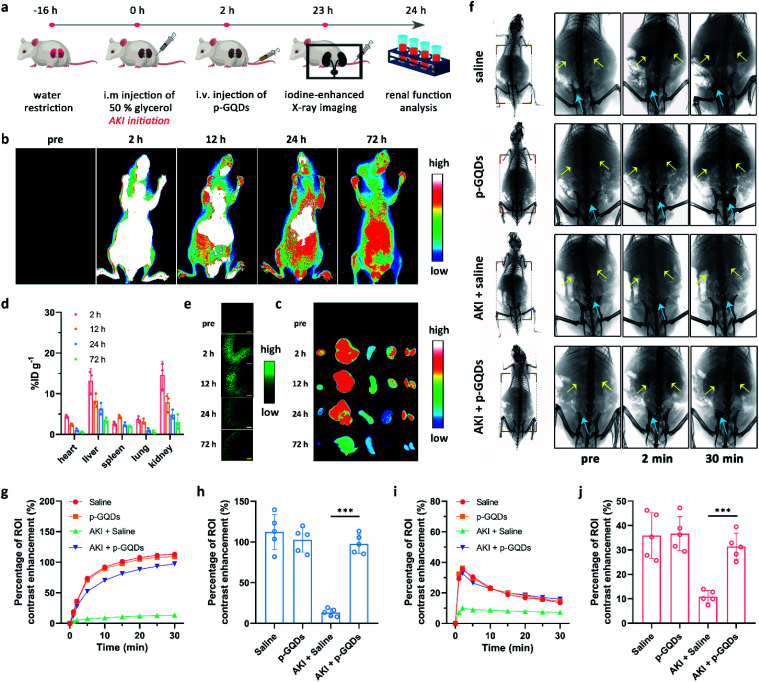
Fig. 6. Bio-distribution and therapeutic effect of p-GQDs in AKI mice. Schematic illustration of the preparation of a murine model with rhabdomyolysis-induced AKI and related in vivo antioxidative therapy of AKI by using p-GQDs (a).Time-dependent in vivo (b) and ex vivo (c) fluorescence imaging of AKI mice after i.v. injection of Cy5.5-p-GQDs. From left to right in (c): the heart, liver, spleen, lungs, and kidneys. Bio-distribution of Cy5.5-p-GQDs from AKI mice after i.v. injection (d).Time-dependent fluorescence imaging of kidney cryosections from AKI mice after i.v. injection of Cy5.5-p-GQDs (e). Relative output is pseudo-colored in green for clear visualization. Scale bars are equal to 500 μm. Error bars represent standard deviation from the mean (n = 3). Representative X-ray images of healthy mice treated with saline, healthy mice treated with p-GQDs, AKI mice treated with saline, and AKI mice treated with p-GQDs at 2 and 30 min after i.v. injection of iopromide (f). Yellow arrows indicate the kidneys and blue arrows indicate the bladder. Time-dependent ROI analysis of X-ray intensity variation (percentage of contrast enhancement) in the bladder (g) and kidneys (i) of mice after various treatments. ROI analysis of X-ray intensity variation in the mouse bladder at 30 min after i.v. injection of iopromide under different treatments (h). ROI analysis of maximal X-ray density variation in the kidneys of mice after various treatments (j). Error bars represent standard deviation from the mean (n = 5). Asterisks indicate statistically significant differences (*P < 0.05, **P < 0.01, and ***P < 0.001).

Fig. 6