. 2020 Aug 5;11(47):12721–12730. doi: 10.1039/d0sc03246h

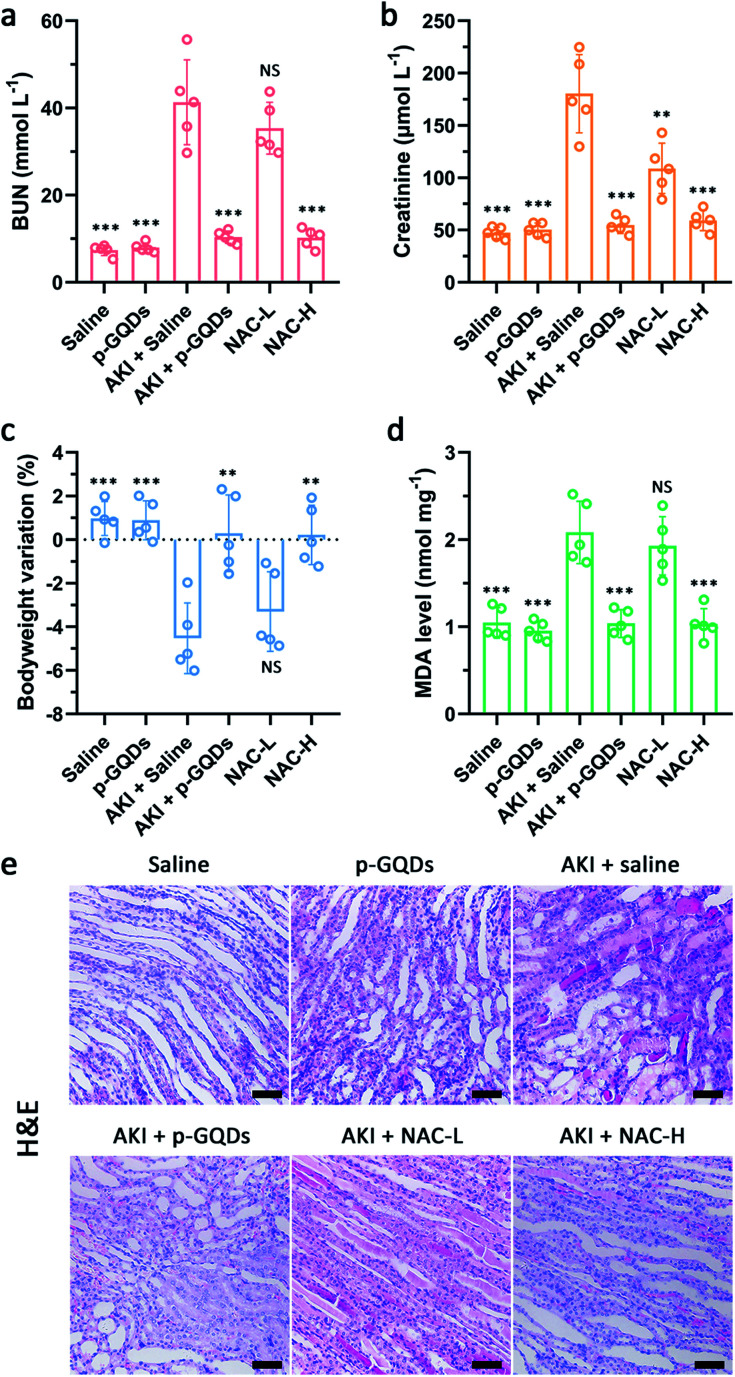
Fig. 7. Blood serum analysis and histopathological analysis of renal tissue after AKI treatment. BUN levels (a) and creatinine levels (b) in the blood after various treatments one day post-initiation of AKI. Bodyweight changes of mice after various treatments one day post-initiation of AKI (c). MDA levels in the homogenates of the kidneys from mice after various treatments one day post-initiation of AKI (d). H&E staining images of kidney tissues collected from mice after various treatments one day post-initiation of AKI (e). Scale bars are equal to 50 μm. Error bars represent standard deviation from the mean (n = 5). Asterisks indicate statistically significant differences (*P < 0.05, **P < 0.01, and ***P < 0.001).

Fig. 7