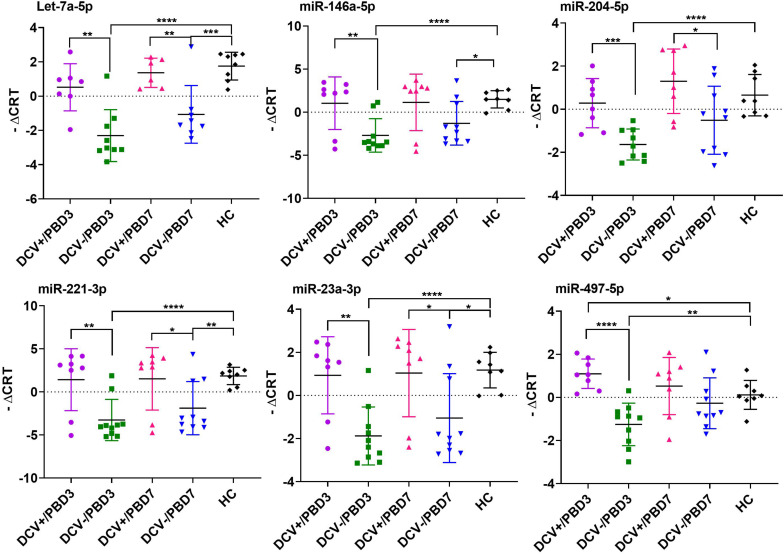
FIGURE 4.
Individual plasma miRNAs that showed highly differential expression in DCV+, DCV–, and HC groups. The differential miRNA expression levels are expressed as –ΔCRT and a two tailed Student’s t-test was used to evaluate the difference between groups. Significant levels expressed as: ****p < 0.0001; ***p = 0.0001–0.001; **p = 0.001–0.01; *p = 0.01–0.05.

