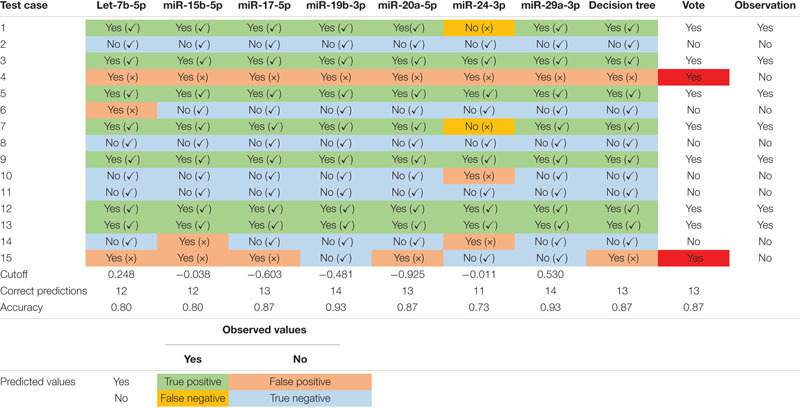
TABLE 4.
Overall performance of DCV risk prediction of the custom miRNA panel.
 |
The table includes seven highly predictive individual miRNAs and the prediction using the decision tree. The cutoff values for each individual miRNA predictor were the mean of the values from the DCV+ and DCV- cases. The cutoff value calculations and corresponding specificity and sensitivity in this prediction can be found in Supplementary File 1.
