
Table 1.
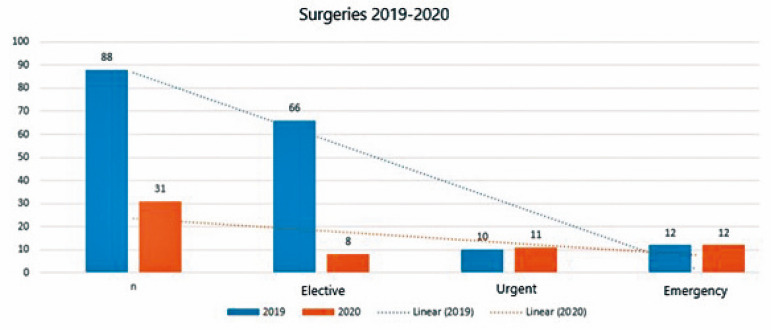
Total number of surgeries from April 1st to July 31st (2019 and 2020), specifying its elective, urgent, and emergency character and its variation between the two periods.
| Total Surgeries - 2019 (N=88) | % | Total Surgeries - 2020 (N=31) | % | P-value | |
|---|---|---|---|---|---|
| Elective | 66 | 75% | 8 | 25.8% | 0.001 |
| Urgent | 60 | 11.4% | 11 | 35.5% | 0.004 |
| Emergency | 12 | 13.6% | 12 | 38.7% | 0.004 |
| |||||