. 2020 Oct 22;11(48):13044–13051. doi: 10.1039/d0sc03166f

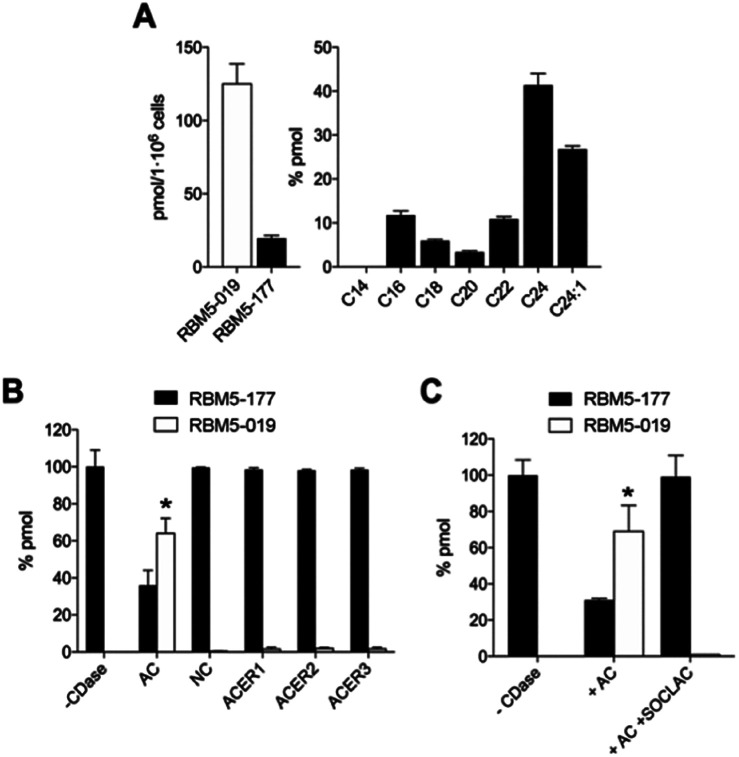
Fig. 2. Metabolization of RBM5-177. (A) A549 cells were incubated with RBM5-177 (5 μM, 30 min) and the lipid extracts were analyzed by UPLC-HRMS. Data (mean ± SD) were obtained from two experiments in triplicate. (B) Lysates from A375/+Dox cells (120 μg), recombinant NC (5 ng) or microsomes from ACER1 (100 μg from HeLa TRex ACER1 cells induced with tetracycline), ACER2 (100 μg from HeLa TRex ACER2 cells induced with tetracycline) or ACER3 (140 μg of Asah2-null mouse embryonic fibroblasts)24 overexpressing cells were incubated with RBM5-177 (5 μM, 30 min) in the appropriate buffer, and the lipid extracts were analyzed by UPLC-HRMS. Data (mean ± SD) were obtained from two different experiments in duplicate. Data corresponding to RBM5-019 were analysed by one way ANOVA followed by Dunnett's multiple comparison post-test if ANOVA < 0.05 (*, P < 0.001 from control without enzyme, −CDase). (C) Lysates from A375/+Dox cells were incubated with RBM5-177 (5 μM, 30 min) prior to treatment with SOCLAC (5 μM, 1 h) and the lipid extracts were analyzed by UPLC-HRMS. Data (mean ± SD) were obtained from two experiments in duplicate. Data corresponding to RBM5-019 were analysed by one way ANOVA followed by Dunnett's multiple comparison post-test if ANOVA P < 0.05 (*, P < 0.001 from −CDase). The right panel in (A) corresponds to the acyl chain of reacylated RBM5-019 (C14, tetradecanoyl, etc.).

Fig. 2