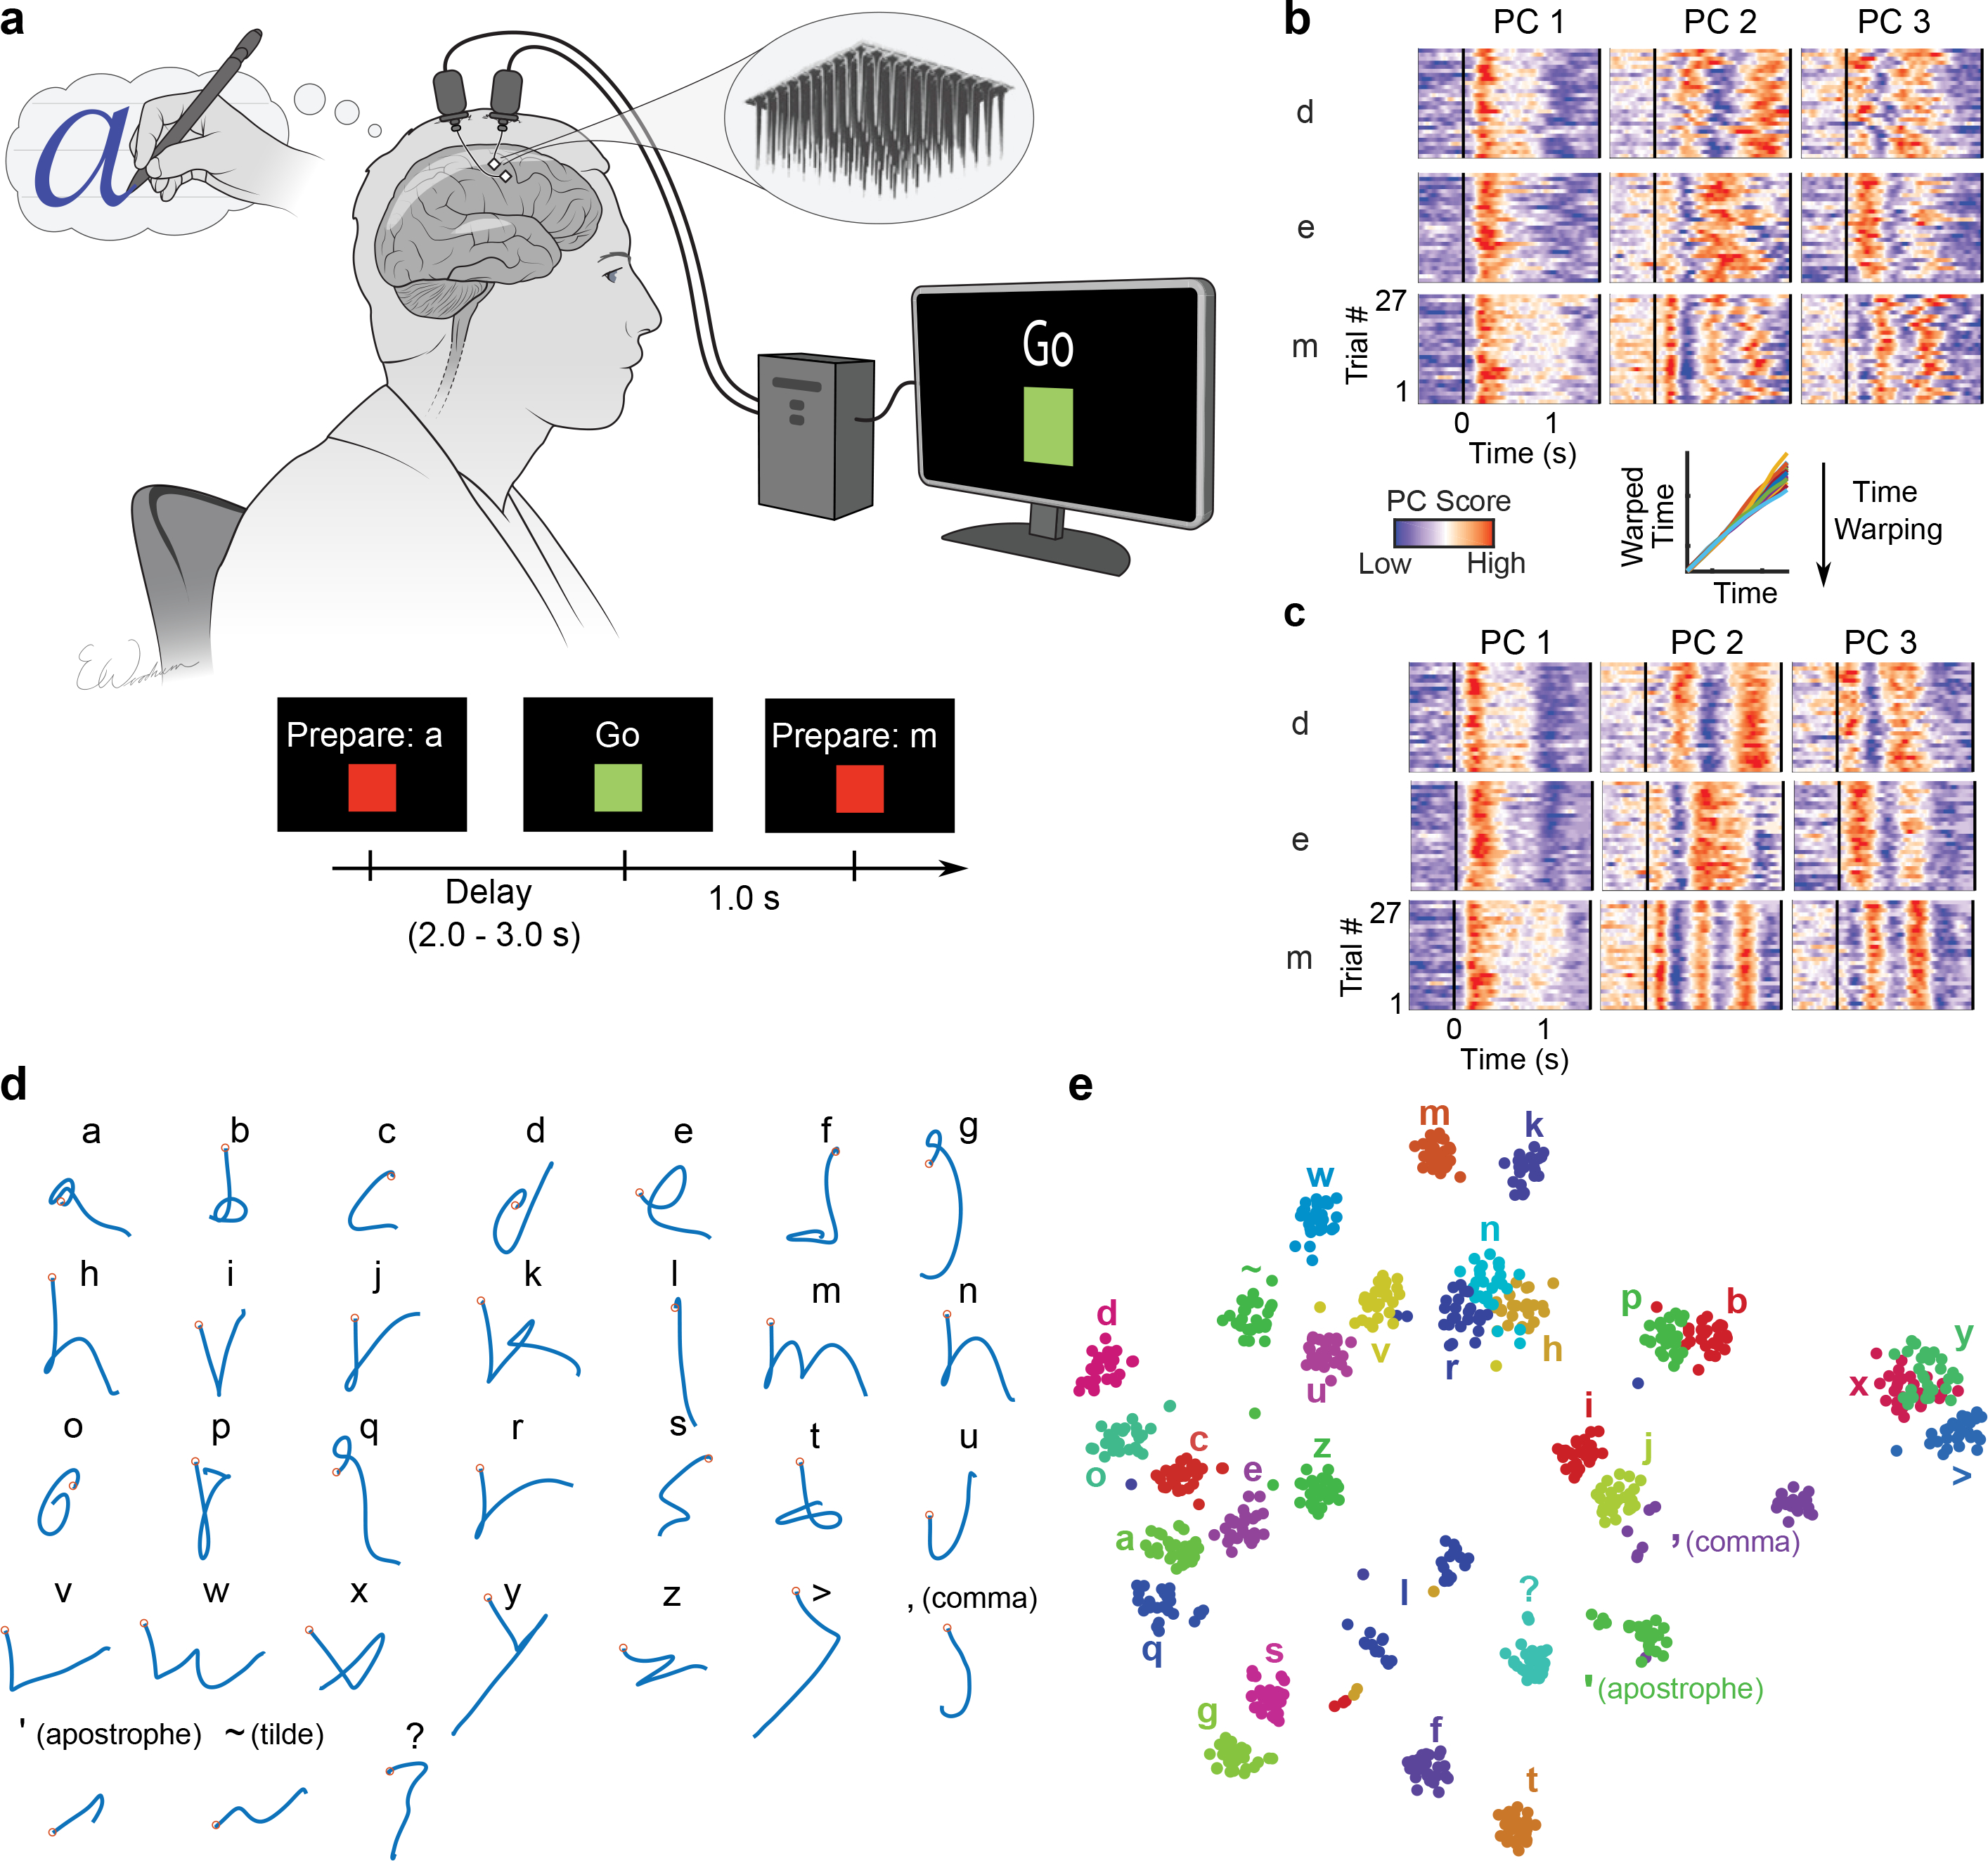
Figure 1. Neural representation of attempted handwriting.

a, To assess the neural representation of attempted handwriting, participant T5 attempted to handwrite each character one at a time, following the instructions given on a computer screen (lower panels depict what is shown on the screen, following the timeline). b, Neural activity in the top 3 principal components (PCs) is shown for three example letters (d, e and m) and 27 repetitions of each letter (‘trials’). The color scale was normalized within each panel separately for visualization. c, Time-warping the neural activity to remove trial-to-trial changes in writing speed reveals consistent patterns of activity unique to each letter. In the inset above C, example time-warping functions are shown for the letter ‘m’ and lie relatively close to the identity line (each trial’s warping function is plotted with a differently colored line). d, Decoded pen trajectories are shown for all 31 tested characters. Intended 2D pen tip velocity was linearly decoded from the neural activity using cross-validation (each character was held out), and decoder output was denoised by averaging across trials. Orange circles denote the start of the trajectory. e, A 2-dimensional visualization of the neural activity made using t-SNE. Each circle is a single trial (27 trials for each of 31 characters).
