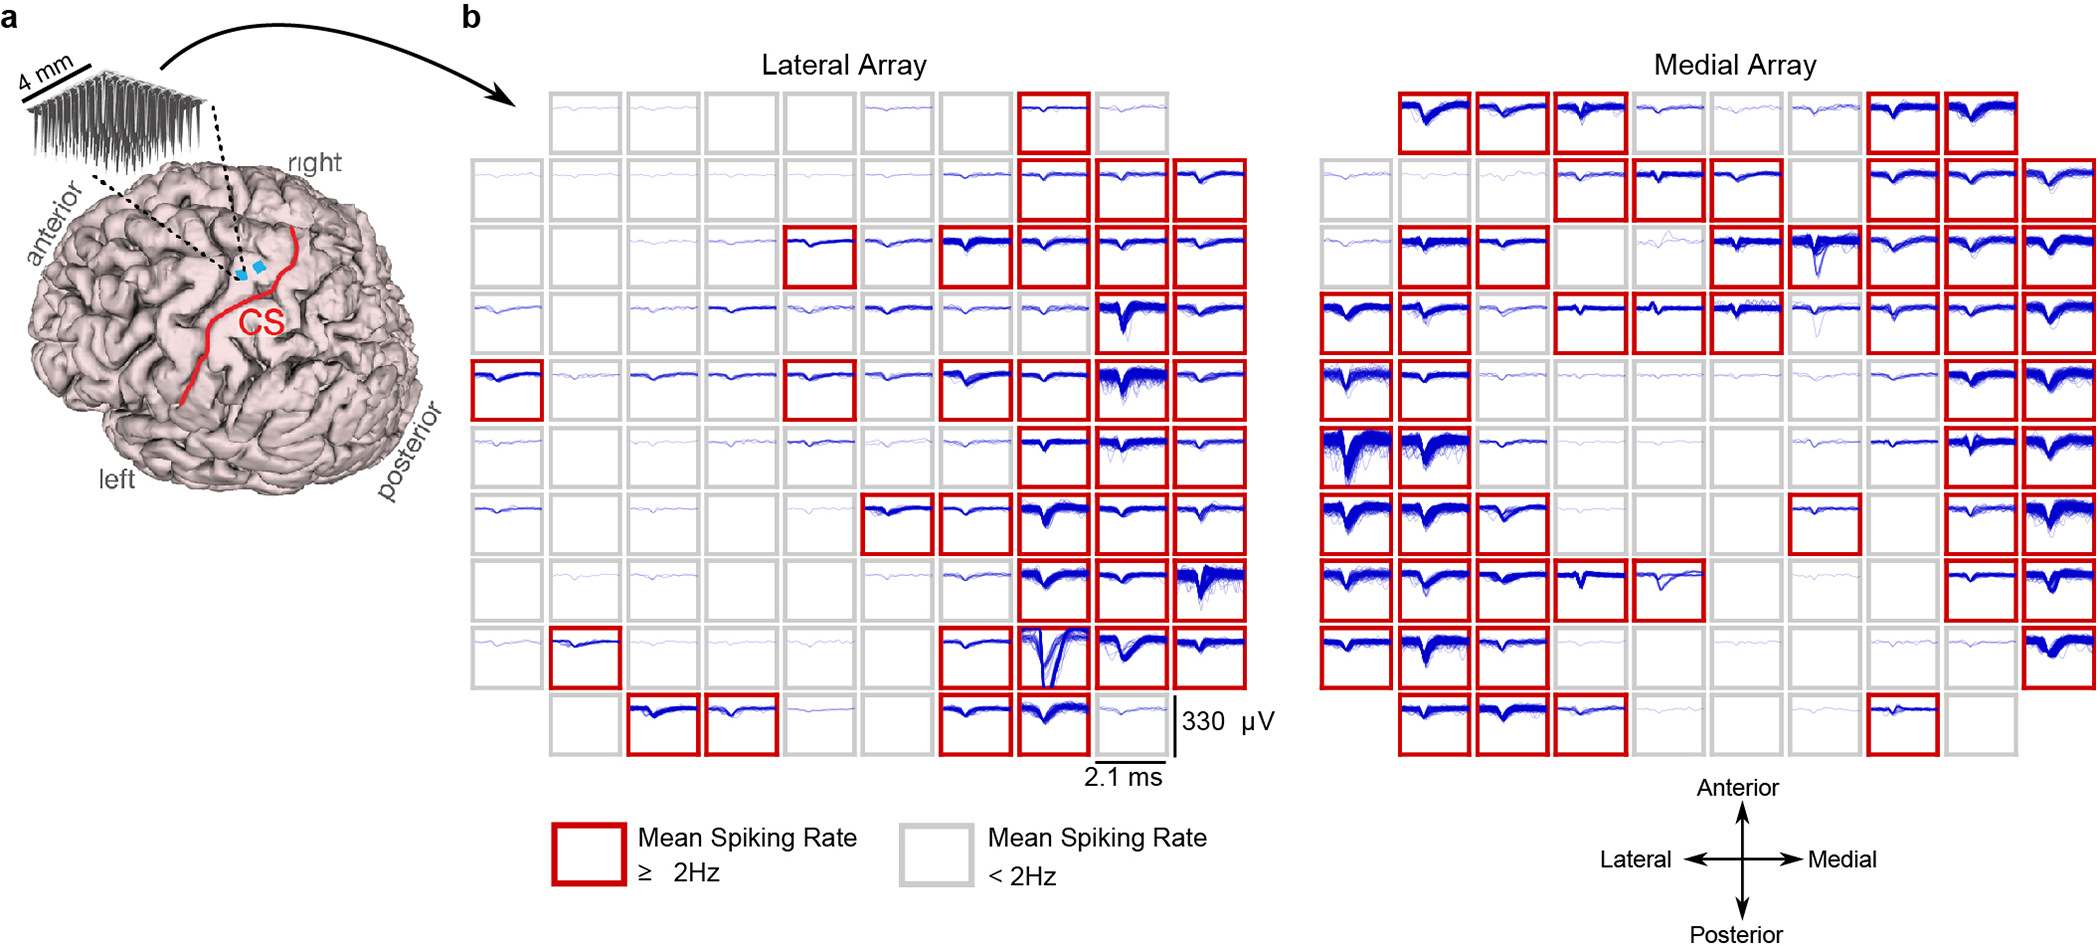
Extended Data Fig. 7: Example spiking activity recorded from each microelectrode array.

(A) Participant T5’s MRI-derived brain anatomy. Microelectrode array locations (blue squares) were determined by co-registration of postoperative CT images with preoperative MRI images. (B) Example spike waveforms detected during a ten second time window are plotted for each electrode (data were recorded on post-implant day 1218). Each rectangular panel corresponds to a single electrode and each blue trace is a single spike waveform (2.1 millisecond duration). Spiking events were detected using a −4.5 RMS threshold, thereby excluding almost all background activity. Electrodes with a mean threshold crossing rate ≥ 2 Hz were considered to have ‘spiking activity’ and are outlined in red (note that this is a conservative estimate that is meant to include only spiking activity that could be from single neurons, as opposed to multiunit ‘hash’). Results show that many electrodes still record large spiking waveforms that are well above the noise floor (the y-axis of each panel spans 330 μV, while the background activity has an average RMS value of only 6.4 μV). On this day, 92 electrodes out of 192 had a threshold crossing rate ≥ 2 Hz.
