. 2020 Jul 29;11(32):8495–8501. doi: 10.1039/d0sc02889d

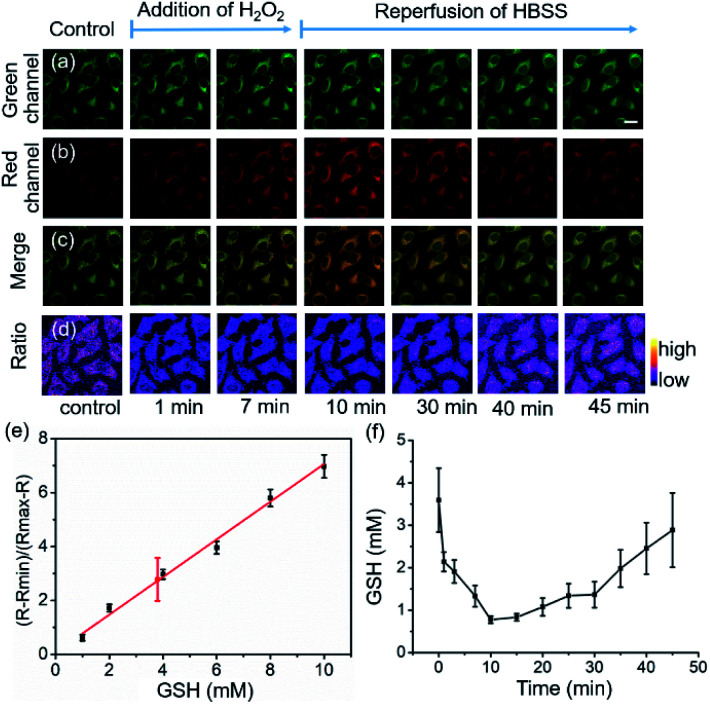
Fig. 3. Feasibility of real-time quantitative monitoring of GSH concentrations in living cells. For (a–d): Real-time GSH imaging with 1 (10 μM) in HeLa cells upon H2O2 (1 mM) treatment with a perfusion system. (a) Green channel; (b) red channel; (c) merge; (d) ratio image. (e) Standard curve of (RRmin)/(RmaxR) as a function of GSH concentration under the same instrument setting as the live cell imaging experiment. R represents the fluorescence intensity ratio between 488 and 543 nm excitation; the data point in red represents the GSH concentration in HeLa cells based on statistical analyses of 11 cells. Error bars represent standard deviations. (f) Time course of GSH concentrations in HeLa cells upon H2O2 (1 mM) treatment. Mean values of GSH concentrations in individual cells (n = 11) were plotted, the error bars represent standard deviations. Scale bar, 10 μm. R is defined as the ratio of the fluorescence intensities between 1-GSH and 1, Rmin and Rmax correspond to the R values at zero and saturated GSH concentrations, respectively.

Fig. 3