. 2020 Jul 30;11(32):8517–8532. doi: 10.1039/d0sc01101k

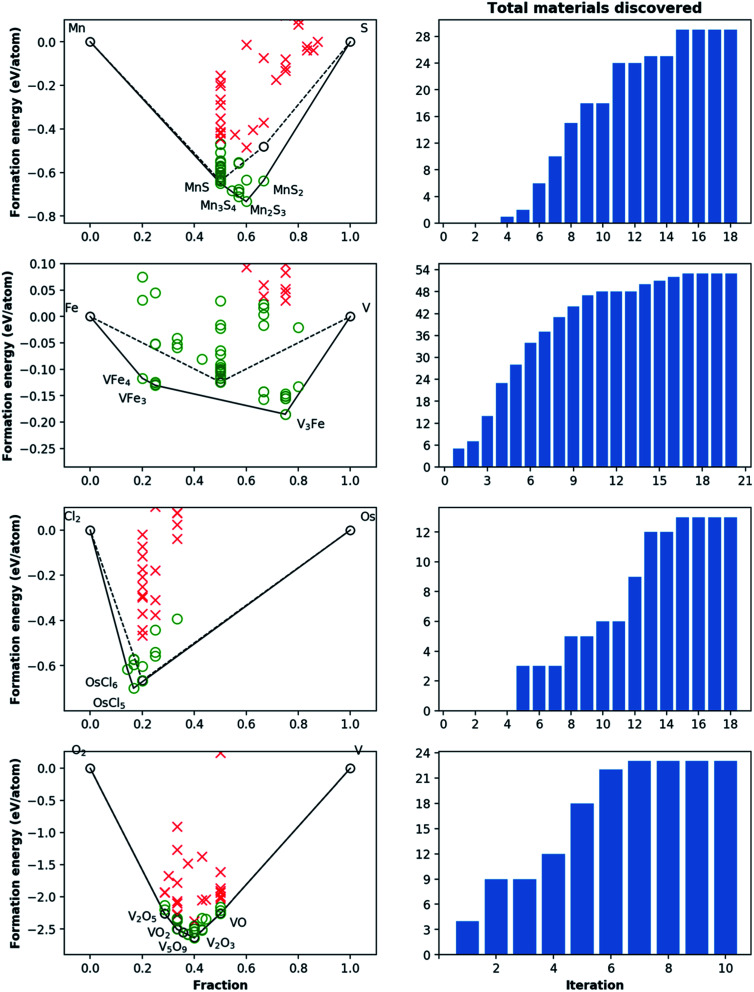
Fig. 6. Phase diagram and cumulative discovery histograms for CAMD campaigns in Mn–S, Fe–V, Os–Cl, and V–O chemical systems. The 2-D phase diagrams are shown on the left with both pre-campaign convex hull (dashed line) and post-campaign convex hull (solid line). Material discoveries, i.e. computed structures within 0.2 eV per atom of the convex hull, are shown as green circles, while materials higher than this threshold are shown as red crosses. The number of total materials discovered for each chemical system as the campaign iterations progress are shown in the right-hand bar charts. For materials from pre-campaign convex-hulls (i.e. existing materials), only the most stable ones are shown for simplicity.

Fig. 6