. 2020 Aug 10;11(33):8919–8927. doi: 10.1039/d0sc02844d

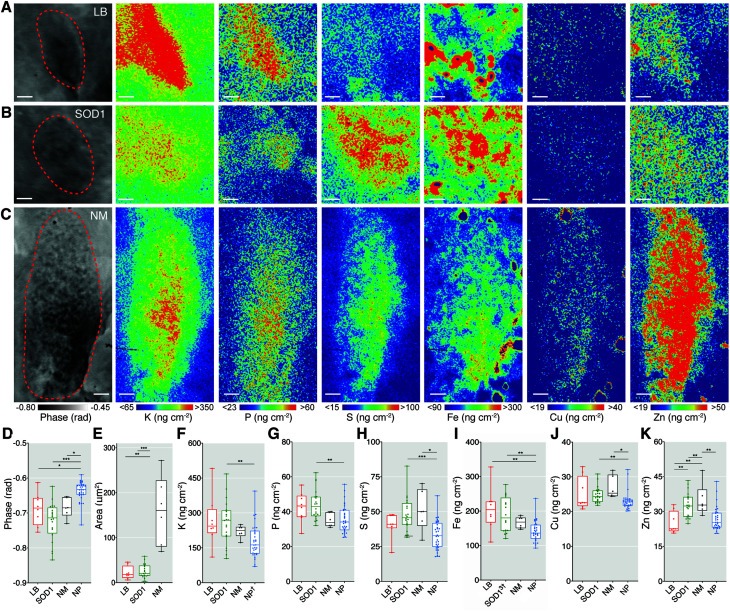
Fig. 2. Quantitative X-ray fluorescence microscopy of LB, SOD1 aggregates and neuromelanin demonstrate distinct elemental fingerprints. (A–C) Phase contrast and XFM images of a representative LB, SOD1 aggregate, and NM deposit in the SN from the PD brain. (D) Greater average phase change per feature confirmed the distinctive compositional variation compared to surrounding neuropil (NP). (E) Proteinaceous LBs and SOD1 aggregates both had average areas of ∼24 ± 15 μm2, while NM granules occupied a larger and more irregular space (160 ± 77 μm2). (F–K) Spatial concentrations (Amass; as ng cm−2 from Kα and Kb emission spectra) of K, P, S, Fe, Cu, and Zn contrasted between features and the encircling neuropil matrix. Scale bars = 1 μm. Structures were sampled from 6–7 PD cases with multiple structures sampled from each case where time was allowed. Total structures analysed; nLB = 8, nSOD1 = 23, nNM = 6, nNP = 32, † = removed outlier. Box-plot graphs depict the median and quartile values as the central line and box boundaries. Whiskers represent min to max values. *p < 0.05, **p < 0.01, ***p < 0.001 based on Kruskal–Wallis (two-sided). Representative images from scan IDs fly25 (LB), fly98 (SOD1), and fly62 (NM).

Fig. 2