. 2020 Jul 6;11(30):7910–7920. doi: 10.1039/d0sc01658f

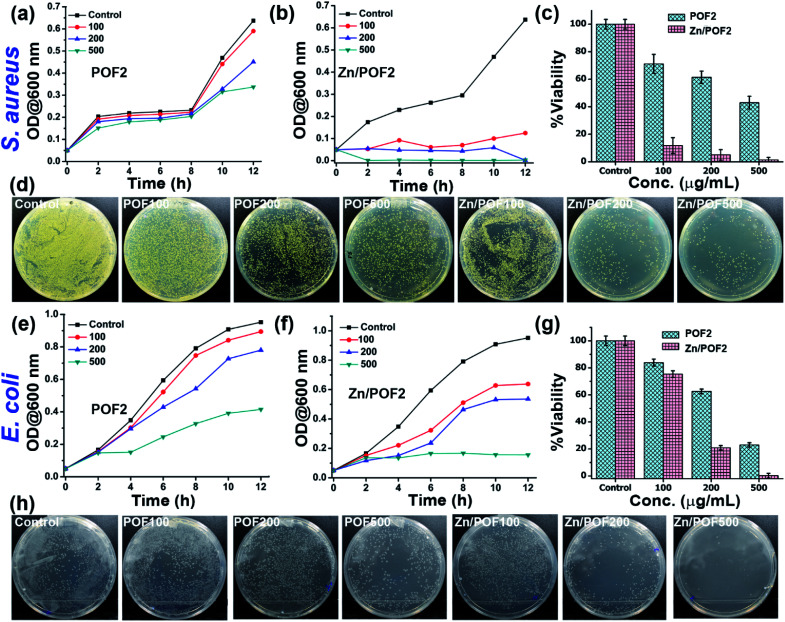
Fig. 3. Antibacterial activity analysis of POF2 and Zn/POF2 by real-time growth curve analysis and systematic colony-forming unit (CFU) imaging. Action against Gram-positive bacteria (Staphylococcus aureus): growth curves of (a) POF2 and (b) Zn/POF2, (c) percentage viability with increasing concentration of POF2 and Zn/POF2, and (d) comparative CFU images with increasing concentration of POF2 and Zn/POF2 (100, 200, and 500 μg mL−1) with respect to the control. Action against Gram-negative bacteria (Escherichia coli): growth curves of (e) POF2 and (f) Zn/POF2, (g) percentage viability with increasing concentration of POF2 and Zn/POF2, and (h) comparative CFU images with increasing concentration of POF2 and Zn/POF2 (100, 200, and 500 μg mL−1) with respect to the control. The error bars represent the standard deviation from the mean (n = 3, mean ± sd).

Fig. 3