Figure 3. Single cell transcriptome analysis reveals a sustained IFN signature in the neutrophil response against HSV-2.
Mice were infected as described in Figure 2. Vaginas were harvested at 5 d.p.i., and live cells were flow sorted and subjected to high-throughput single-cell RNA sequencing (scRNA-seq). (A) A t-Distributed Stochastic Neighbor Embedding (tSNE) visualization of 21,633 cells across all mice resolves 17 distinct clusters in the vaginal tissue. Clusters can be identified as myeloid cells (red border), epithelial cells (blue border), or lymphocytes (purple border). Neutrophils are encircled in black and contain three distinct clusters (0, 2, and 5). (B) Neutrophils are defined by high expression of S100a8 and Csf3r (G-SCFR). (C) tSNE plots of vaginal cell clusters from mock-inoculated or HSV-infected mice. Neutrophil populations are circled in black. (D) Distribution of expression for genes within the Hallmark IFNa Response gene set. (E) Production of IFNβ in vaginal washes collected at 4 and 5 d.p.i. as measured by ELISA (uninfected: n = 8, HSV-1: n = 9, HSV-2: n = 9). scRNA-seq in A-D was performed once. Data in E are pooled from two independent experiments. Statistical significance was measured by one-way ANOVA with Tukey's multiple comparisons test. *p<0.05, **p<0.01, ***p<0.005. Raw values for each biological replicate, specific p values, and complete lists of differentially expressed genes between clusters 0, 2, and 5 are provided in Figure 3—source data 1.

Figure 3—figure supplement 1. ISGs are differentially expressed in neutrophils during HSV-1 and HSV-2 infection.

Figure 3—figure supplement 2. Validation of ISG expression in the vagina.

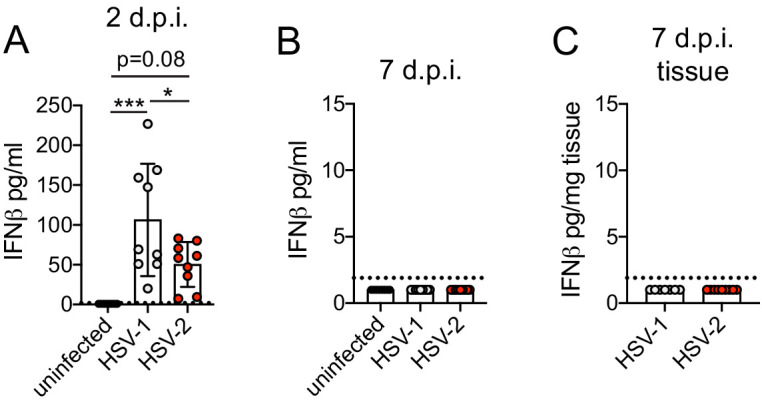
Figure 3—figure supplement 3. Type I IFN is produced early in the vagina and resolves by 1 week after acute HSV-1 or HSV-2 infection.